Recent Radiation Monitoring
SW Oregon Radiation Monitoring for the Coos Bay &
North Bend area
You're at: https://57296.neocities.org/rad.htm
See Space Weather
for current solar/storm news.
We can follow the demise of the nuclear industry via
Ring
of Fire, Common
Dreams, Truthdig,
the Bradcast, and others.
Last worked on: Thursday, May 16th, 2024 (and a recent
link)
5/16/2024 update linked here.

* 24 hour averaged graphs used to be posted here on
the 16th day, the end of the month, or within 24 hours of an event, but
now I'm barely doing any "spot checks" (using my reborn
Medcom "Inspector" Geiger counter). I set it to tally 100 minute counts
and place it in the same outside station (painted white, 40 inches above
the ground) as in the past. This might be done every day if something's
going on in the world. Of course I can no longer note minute long counts
of 33 (and up).
Such counts should be done at roughly the same time
of day and during the warmer part of the day (in deference to the Geiger
counter's electronics). Whether inside the house or inside my outdoor station,
the GC remains inside a sealed ZipLoc baggy with desiccant. Geiger counters
like mine tally mostly gamma rays plus maybe
muons and energetic beta, but no alpha. I might catch some lower energy
beta when I check an air filter in close proximity.
* My 100 minute counts are only significant to two
figures, so I'm now reporting in whole percentage points (which has been
the visual resolution of my posted graphs).
end of 5/3/2024 update.

* Past monitoring graphs &
comments.
* Other radiation monitoring
networks.
* The nuclear power industry is staging a come-back,
by way of "small modular reactors" ("SMRs"), which would be manufactured,
shipped and assembled on site, rather than custom built. One design (backed
by Bill Gates) uses (scary) high temperature
molten sodium for the initial heat transfer/cooling/storage loop. Another
SMR design, the NuScale project, was hatched right here in Oregon and has
already gained a lot of federal approval/backing. Here's an article at
Mother Jones:
https://www.motherjones.com/environment/2021/02/nuclear-energy-climate-change-nuscale-green-power-uranium/
and see: https://www.amazon.com/Confessions-Nuclear-Regulator-Gregory-Jaczko/dp/1476755760
--plus
Testimony from nuclear
industry insider Dirk Dunning.

Radiation Monitoring
~ 2021/12/26: A 100 minute count at 98% of average,
starting at 13:30 hours PST (UTC/GMT minus 8 hours). We're having rainy
cold days, but when I charted for temperature
(and another time for rain), there was no
correlation (despite the flutters seen in Germany's
system during rain storms).
~ 2022/01/02: A 100 minute count at 94% of average,
starting at 13:24 hours PST. Very little rain now. Solar cycle #25 is getting
started plus there's a minor stream of solar wind hitting the Earth (which
repels cosmic rays). Also: my long term baseline (which was done indoors)
for the Medcom GC is rather dated (14.82cpm from an SBM-20
GM tube).
~ 2022/01/08: 100 min count at 99% of average,
starting at 12:15 hours PST. No rain today.
~ 2022/01/21: 100 min count at 98% of average,
starting at 15:15 hours PST. No rain today.
~ 2022/02/21: 100 min count at 99% of average,
starting at 13:25 hours PST. Some rain today.
~ 2022/02/27: 100 min count at 88% of average,
starting at 12:34 hours PST.
~ 2022/03/03: 100 min count at 92% of average,
starting at 12:34 hours PST.
~ 2022/03/08: 100 min count at 90% of average,
starting at 16:49 hours PST.
~ 2022/03/14: 100 min count at 93% of average,
starting at 13:26 hours PDT (UTC/GMT minus 7h).
~ 2022/03/18: 100 min count at 92% of average,
starting at 12:17 hours PDT.
~ 2022/03/22: 100 min count at 99% of average,
starting at 12:40 hours PDT. Solar wind subsides?
~ 2022/03/27: 100 min count at 89% of average,
starting at 15:40 hours PDT. Many sunspots
~ 2022/03/29: 100 min count at 91% of average,
starting at 17:22 hours PDT. Solar flare @ 15:00.
A CME due on 3/31 @ 03:00 hours UT (= 3/30 here @ 20:00 hours PDT)
~ 2022/03/30: 100 min count at 92% of average,
starting at 12:42 hours PDT. There've now been
3 recent big flares with Earthbound CMEs (corona mass ejections) from the
Sun.
~ 2022/04/05: 100 min count at 90% of average,
starting at 17:09 hours PDT. (Sun quite active)
~ 2022/04/12: 100 min count at 93% of average,
starting at 11:01 hours PDT. (Sun quite active)
~ 2022/04/26: 100 min count at 91% of average,
starting at 13:40 hours PDT. (Sun active)
~ 2022/04/29: 100 min count at 93% of average,
starting at 12:20 hours PDT. (Raining)
~ 2022/05/05: 100 min count at 98% of average,
starting at 10:18 hours PDT. (Raining, Sun active)
~ 2022/05/16: 100 min count at 93% of average,
starting at 16:10 hours PDT. (Sun active)
~ 2022/05/23: 100 min count at 93% of average,
starting at 15:35 hours PDT. (Sun not active)
~ 2022/06/11: 100 min count at 90% of average,
starting at 15:41 hours PDT. (Raining, Sun active)
~ 2022/06/28: 100 min count at 96% of average,
starting at 14:42 hours PDT.
~ 2022/06/30: 100 min count at 99% of average,
starting at 11:05 hours PDT.
~ 2022/07/17: 100 min count at 99% of average,
starting at 16:40 hours PDT. (Sunspots "153")
~ 2022/07/26: 100 min count at 94% of average,
starting at 12:08 hours PDT. (Sunspots "100")
~ 2022/08/03: 100 min count at 97% of average,
starting at 13:46 hours PDT. (Sunspots "031")
~ 2022/08/12: 100 min count at 93% of average,
starting at 17:02 hours PDT. (Sunspots "097")
~ 2022/08/22: 100 min count at 95% of average,
starting at 15:00 hours PDT. (Sunspots "056")
~ 2022/09/03: 100 min count at 98% of average,
starting at 16:00 hours PDT. (Sunspots "071")
~ 2022/09/08: 100 min count at 94% of average,
starting at 11:04 hours PDT. (Sunspots "073")
~ 2022/09/18: 100 min count at 100% of average,
starting at 13:08 hours PDT. (Sunspots "076")
~ 2022/09/28: 100 min count at 100% of average,
starting at 16:10 hours PDT. (Sunspots "110")
~ 2022/10/17: 100 min count at 101% of average,
starting at 11:08 hours PDT. (Sunspots "059")
~ 2022/10/26: 100 min count at 97% of average,
starting at 11:19 hours PDT, (Sunspots "072")
~ 2022/11/20: 100 min count at 94% of average,
starting at 13:14 hours PST, (Sunspots "059")
~ 2022/12/03: 100 min count at 96% of average,
starting at 13:53 hours PST, (Sunspots "066")
~ 2022/12/24: 100 min count at 99% of average,
starting at 15:25 hours PST, (Sunspots "100") raining
~ 2023/01/09: 100 min count at 91% of average,
starting at 10:27 hours PST, (Sunspots "142")
(A NASA satalite with RTG power burned up on re-entry over the Bering Sea
today.)
(We're under threat of X-class solar flares today and an X-1.9 blew already.)
(Solar activity suppresses cosmogenic radiation, about 10% of my counts
here?)
~ 2023/01/20: 100 min count at 90% of average,
starting at 15:37 hours PST, (Sunspots "166")
~ 2023/02/11: 100 min count at 95% of average,
starting at 10:09 hours PST, (Sun "190" + an X-1 flare)
~ 2023/12/16: There was an X-2.8 Flare on 12/14,
so I did four 100 minute counts: morning to late afternoon --trying to
catch a predicted mid-day CME arrival (which didn't arrive). The four averaged
90.5% of the year 2014 average.

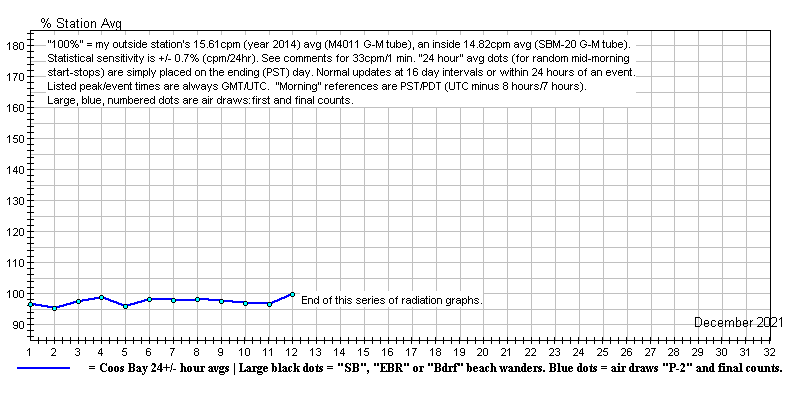
December - 2021
~ 2nd: 33cpm peak at 18:26 hours (isolated).
~ 12th: The computer dedicated to tallying counts
from my outside station suffered the Black Screen of Death, so I'm ending
this series of graphs. I'll keep this and the older graphs page posted,
should anyone wish to harvest data from them.
* I suggest:
> http://www.gmcmap.com/
--for the northern hemisphere and:
> http://sccc.org.au/archives/2630
--for the southern --as replacements. At these
web sites you can access current readings as well as station histories,
although you'll have to determine station cpms as baseline percentages
on your ownmanually. (I'm not sure what the GMC station averages represent.
Find out.)
See Peter Daley's list of monitoring stations as
well --at:
> http://sccc.org.au/wp-content/uploads/2016/07/International-Radiation-Monitoring-Station-List.pdf

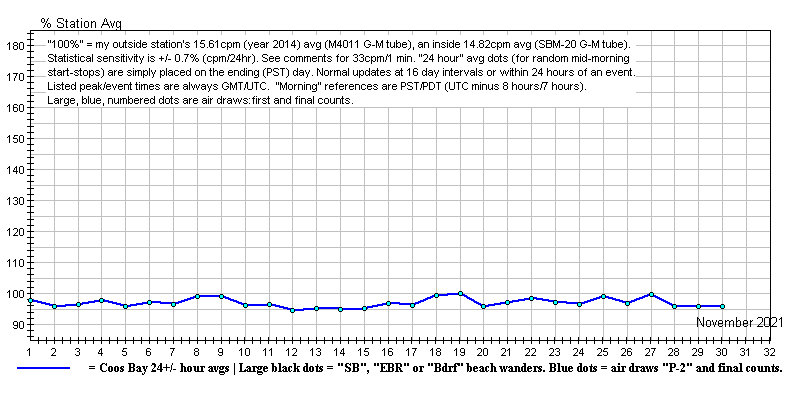
November - 2021
~ 12th: No new graph yet, but the daily average
dropped to 94.6% (below my arbitrary 95% threshold) this morning. The Sun
is active, but on the far side.
~ 14th: The daily average over the past (nominal)
24 hours was 94.9 this morning.
~ 17th: 33cpm peak at 21:38 hours (isolated).
~ 30th: No other threshold (33cpm) crossing peaks
(or dips) as of this morning (PST/PDT).

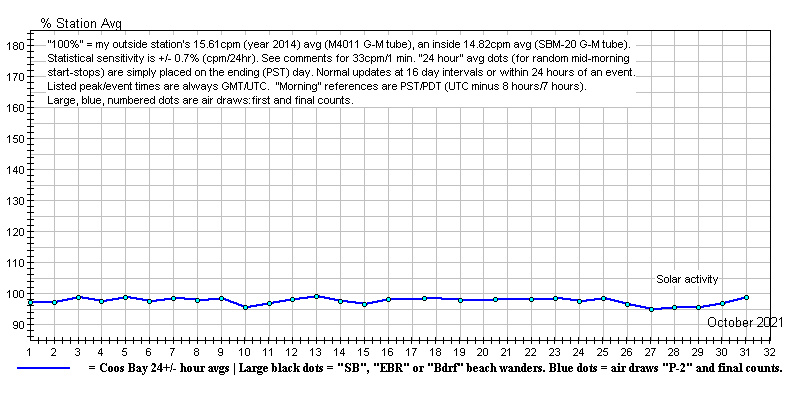
October - 2021
~ 6th: 33cpm peak at 02:05 hours (isolated).
~ 11th: 33cpm peak at 09:54 hours (isolated).
(Direct hit of a mild CME "today".)
~ 27th: The daily average dropped to 94.9% (below
the 95% threshold) this morning.
~ 31st: No other threshold (33cpm) crossing peaks
(or dips) as of this morning (PST/PDT).

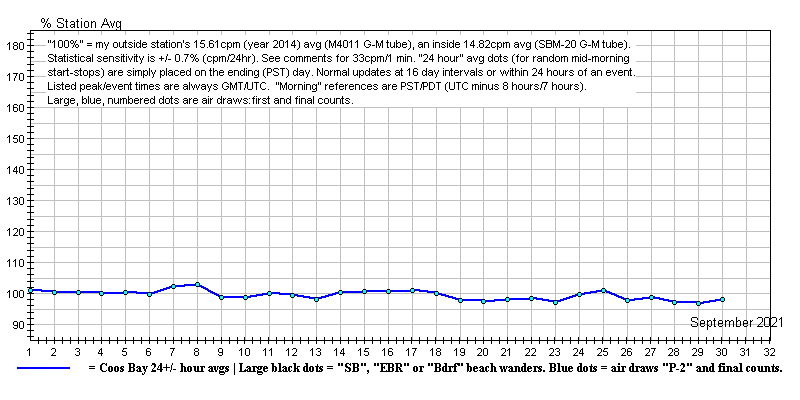
September - 2021
~ 8/31: 33cpm peak at 18:04 hours (very brief build-up,
saved screen).
~ 3rd: 33cpm peak at 01:16 hours (isolated).
~ 6th: 33cpm peak at 23:30 hours (mini build-up,
saved screen).
~ 8th: 33cpm peak at 10:22 hours (isolated).
~ 9th: 33cpm peak at 12:06 hours (isolated).
~ 15th: 34cpm peak at 11:15 hours (isolated).
~ 30th: No other threshold (33cpm) crossing peaks
as of this morning (PST/PDT).

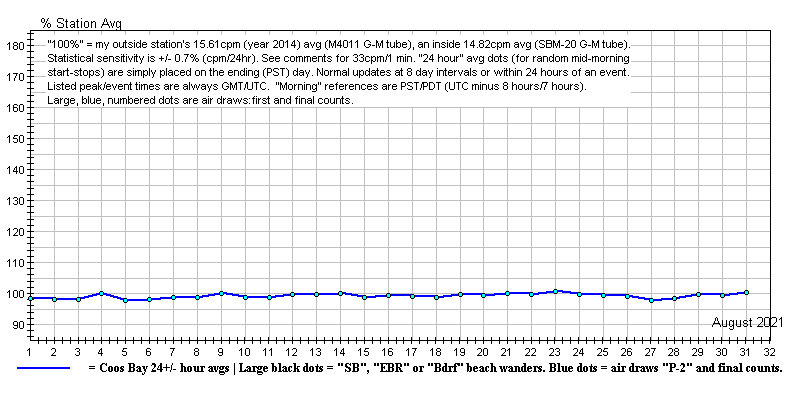
August - 2021
~ 15th: 36cpm peak at 20:03 hours (isolated).
~ 28th: 33cpm peak at 02:19 hours (isolated).
~ 16th: No other threshold (33cpm) crossing peaks
as of this morning (PST/PDT).

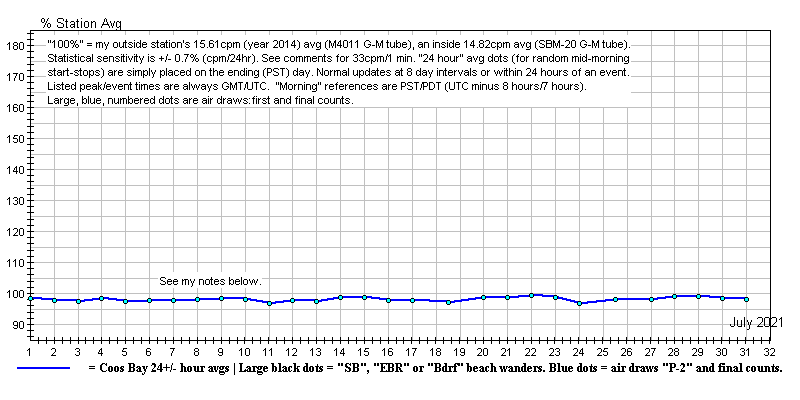
July - 2021
~ 16th: This graph is very calm due to solar activity
and solar wind pushing primary cosmic rays away from the Earth. What remains
might be the true "base line" at about 96% --which could be due to local
activity in/from the soil or even contamination inside the G-M tube I'm
using (an M4011). For what it's worth, nearly all stations in the network
(Radiation Network) I once belonged to reported a very similar, minimum
level of radioactivity. So does Germany's government network of $3000 G-M
tubes. As you can read elsewhere on my radiation pages, I've tried and
failed to run this "96%" to ground. It's been 10 years along and I don't
know what I'm counting.
~ 21st: 35cpm peak at 02:22 hours (isolated).
~ 26th: 33cpm peak at 16:28 hours (isolated).
~ 31st: No other threshold (33cpm) crossing peaks
as of this morning (PST/PDT).

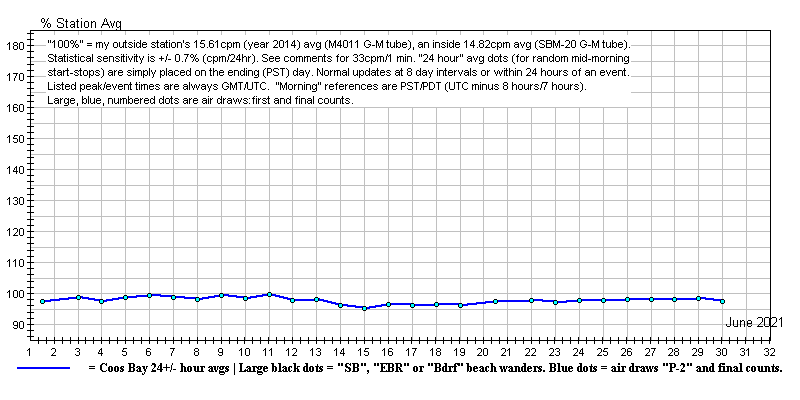
June - 2021
~ 9th: 33cpm peak at 03:42 hours UTC (isolated).
~ 9th: 33cpm peak at 21:10 hours (isolated).
~ 18th: Late posting. My graphics computer was
being worked on.
~ 30th: No other threshold (33cpm) crossing peaks
as of this morning (PST/PDT).

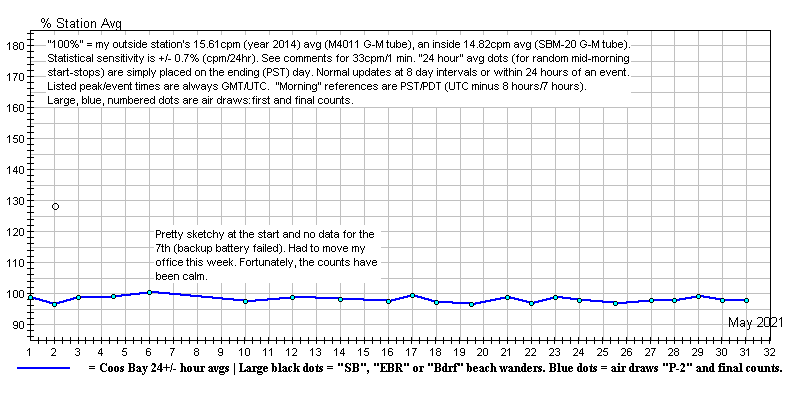
May - 2021
~ 1st: 33cpm peak at 04:34 hours (isolated).
~ 10th: 33cpm peak at 22:09 hours (isolated).
~ 23rd: 36cpm peak at 04:48 hours (isolated).
~ 31st: No other threshold (33cpm) crossing peaks
as of this morning (PST/PDT).

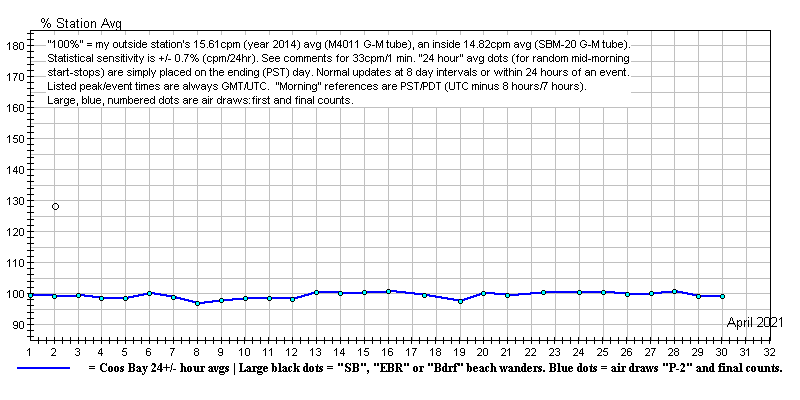
April - 2021
~ 3rd: 33cpm peak at 19:00 hours (isolated).
~ 6th: 34cpm peak at 14:02 hours (isolated).
~ 25th: 33cpm peak at 03:54 hours (isolated).
~ 27th: 34cpm peak at 04:26 hours (isolated).
~ 30th: No other threshold (33cpm) crossing peaks
as of this morning (PST/PDT).

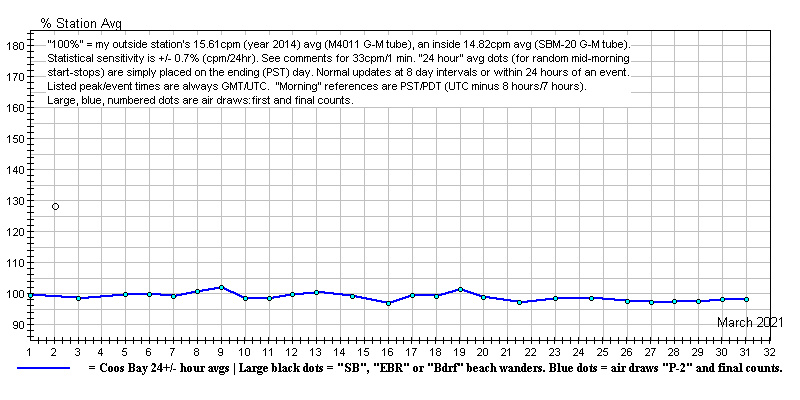
March - 2021
~ 11th: Tenth anniversary of the Fukushima disaster.
~ 31st: No threshold (33cpm) crossing peaks this
month! (as of this morning, PST/PDT).

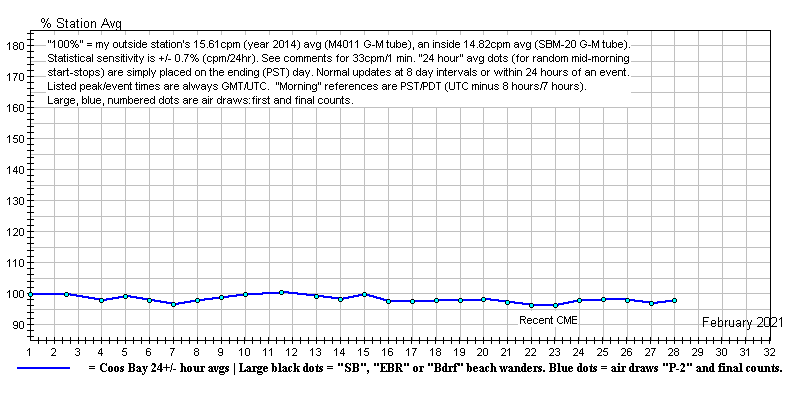
February - 2021
~ 14th: 34cpm peak at 22:32 hours (isolated) (all
UTC).
~ 28th: 33cpm peaks at 07:54 and about 13:00 hours
(both isolated).
~ 28th: No other threshold (33cpm) crossing peaks
as of this morning (PST/PDT).

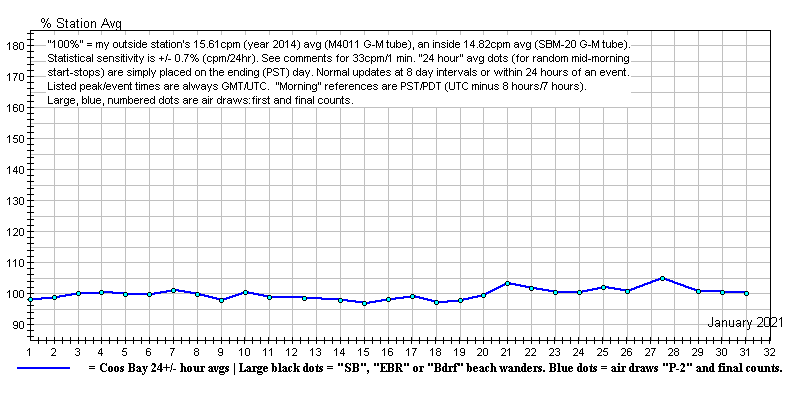
January - 2021
~ 6th: 35cpm peak at 18:31 hours (isolated)
(all UTC).
~ 10th: 33cpm peak at about 12:00 hours (isolated).
~ 31st: No other threshold (33cpm) crossing peaks
as of this morning (PST/PDT).

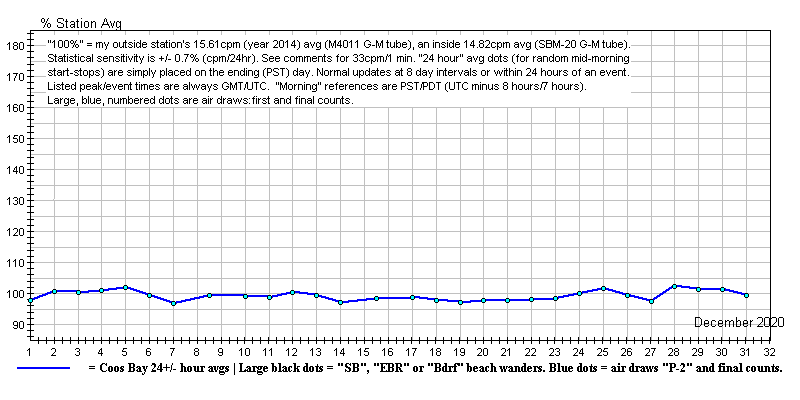
December - 2020
~ 2nd: 37cpm peak at 07:13 hours (isolated)
(all UTC).
~ 31st: No other threshold (33cpm) crossing peaks
as of this morning (PST/PDT).
Go to: Past monitoring & comments.


