Past Radiation Monitoring & Comments
SW Oregon Radiation Monitoring for the Coos Bay &
North Bend area
(See also: current/recent monitoring)
See Space Weather
for current solar/storm news. Energy News
(check beyond their often lurid headlines) has slacked off in 2016.
We can follow the demise and poisonous death throws of
the nuclear industry via Ring
of Fire, Common
Dreams, Truthdig
and others.
You're at: https://57296.neocities.org/rad-2.htm
Contents
Last worked on: May 16th, 2024
fast find>> Preamble,
Air
sampling, Air update, Solar flares,
Graphs,
CPMs & Geiger counters,
Food,
Graphing,
About,
Beaches,
G-M tube failure, Networks,
My
choice of units, Statistics,
Question,
Submersion test, A
typical day graph, Reminders,
Notes & commentaries, Fukushima,
Medical
technetium-99m,
Radium, My
graphing pgm, Network suggestions, Draft
letter, Fukushima-3,

5/16/2024 update: Solar Cycle 25 is more active than
predicted. Here's
a current summary and my earlier comments.
* (7/18/2019): Today's (Brad Friedman) "Bradcast"
(stream it or download the MP3) brings the dismaying news that the Trump
administration (among its many other environmental outrages) is trying
to cut way back on the safety and supervision of our aging nuclear power
plants.
* (6/30/2019): :-(
It's turned out that the SBO nature of the Fukushima
disaster left both the mainstream and alternative media that I follow with
no lasting impression. In the news this past week have been unveiled international
threats --deliberately leaked stories about Russia and the United States
having planted destructive computer viruses in each other's power grid
system controllers. I saw nothing about the consequences of multiple
nuke
power plant melt downs (hundreds of them!) should those viruses get
activated.
My "Background Radiation"
Graphs
(start out rather humbly.)
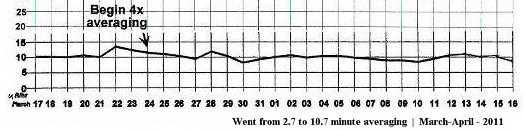
March-April 2011 (10 uR/hr ~ 35cpm with my Medcom Geiger
counter, 15.61cpm with my M4011 device, and 14.82cpm with my SBM-20 G-M
tube device.)
The Fukushima disaster occured on March 11th.
* These early graphs are based on
averaged uR/hr readings, using a Radex 1503 Geiger counter with an SBM-20
tube. I would repeatedly wait out the 1503's internal 2.7 minute averaging
cycle, note the reading, then average those averages. The 1503 will not
display CPMs.
22nd: That peak is probably no more significant
than the next. I was only taking 2.7 minute counts (+/- 7.2cpm or +/- 2uR),
but went to 10.7 minute averages on the 24th (+/-3.6cpm). (I was using
twice the "standard error", based on the square root of the assumed total
count.)
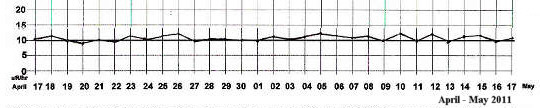
April-May 2011
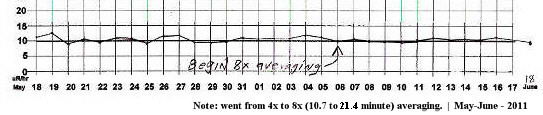
May-June 2011
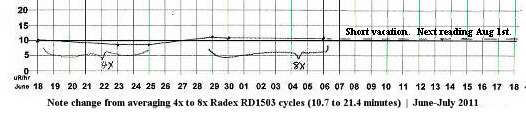
June-July 2011 (uR/hr)
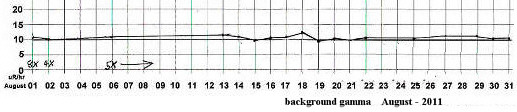
August 2011
(Dropped back to 5x averaging on August 6th. Note that
days pass between readings.)
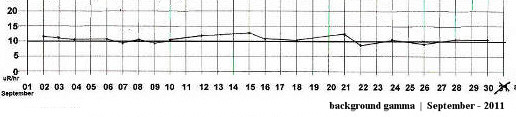
September 2011
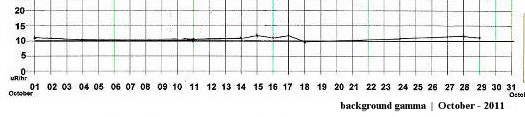
October 2011 (uR/hr)
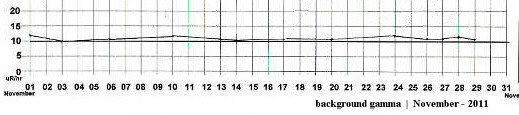
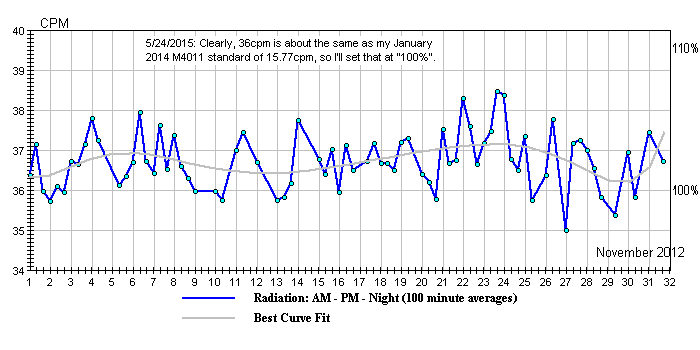
November 2012
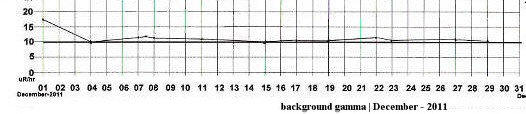
December 2011
(Dropped back to 5x averaging on August 6th. Note that
days pass between readings.)
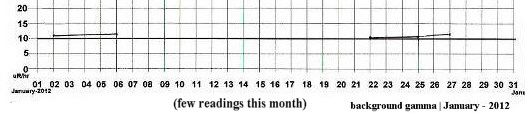
January 2012 (uR/hr)
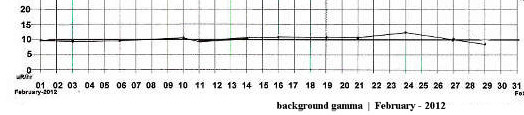
February 2012
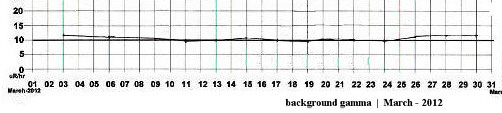
March 2012
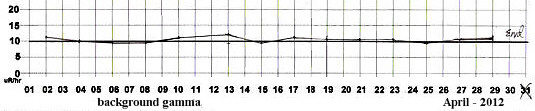
April 2012 (uR/hr)
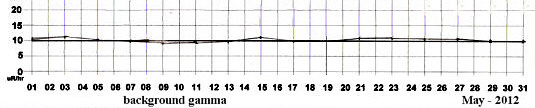
May 2012
The graphs beyond this point change scale and are
primarily calibrated in (Medcom "Inspector") CPM,
sometimes with supplemental uR/hr equivalents on the
right margin.
(10 uR/hr = about 35cpm with the Medcom Geiger counter)
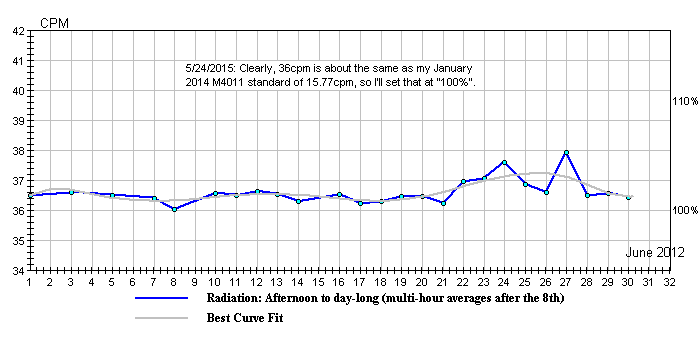
June 2012
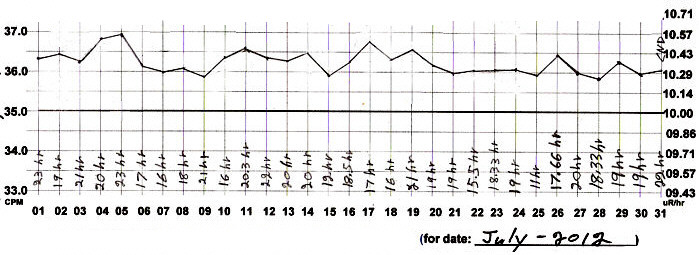
July 2012
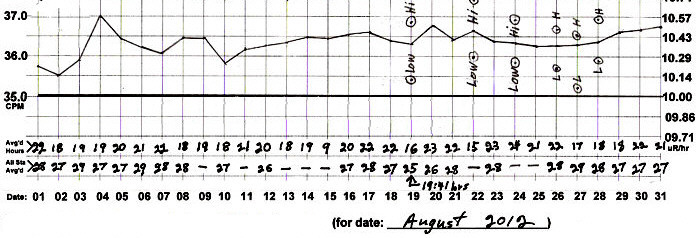
August 2012
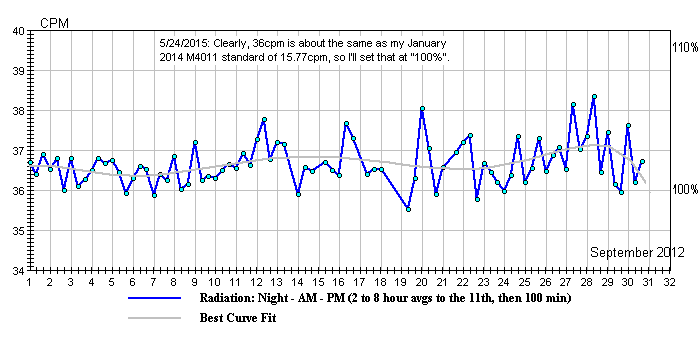
September 2012
* That increase in variation after the 11th is due to
reducing the averaging period from hours to 100 minutes. We expect +/-0.6cpm
of jiggle at this level of detection and averaging of "Poisson distributed"
radiation data.
October 2012
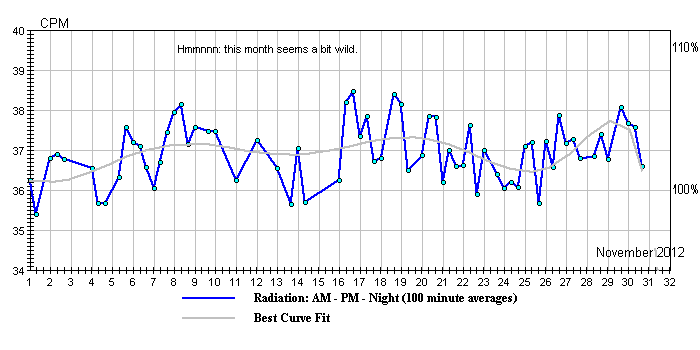
November 2012
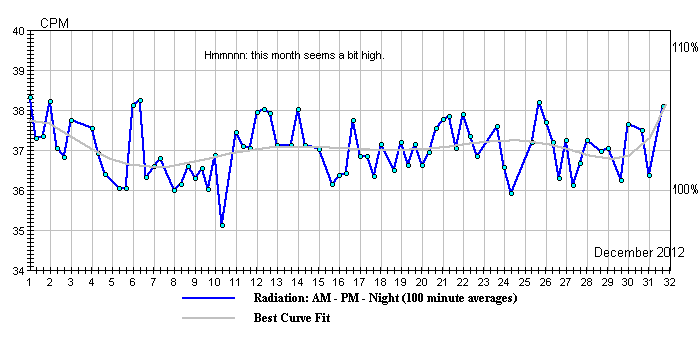
December 2012
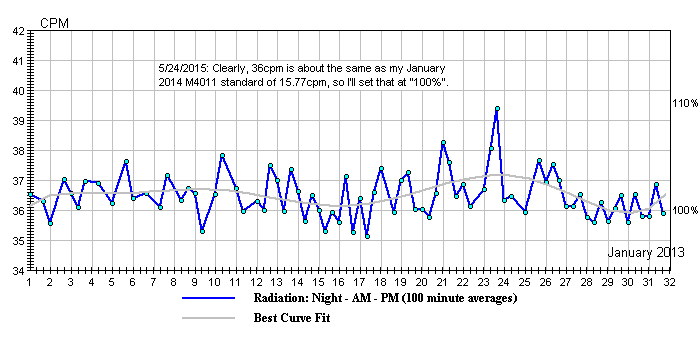
January 2013
23rd: Confirmed high BG
with 2 extra mid-day 100min counts; 26th: +24.5/14.4cpm
mid-day AFs. (Mid-day 10min BGs
of 38 & 41.2cpm.)
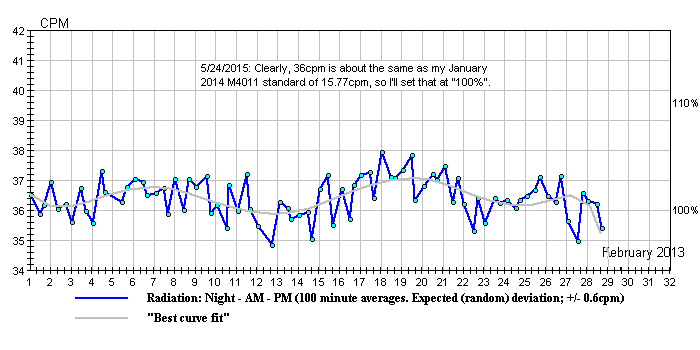
February 2013
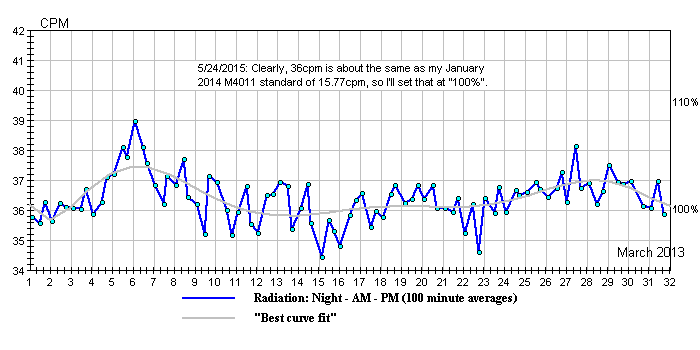
March 2013
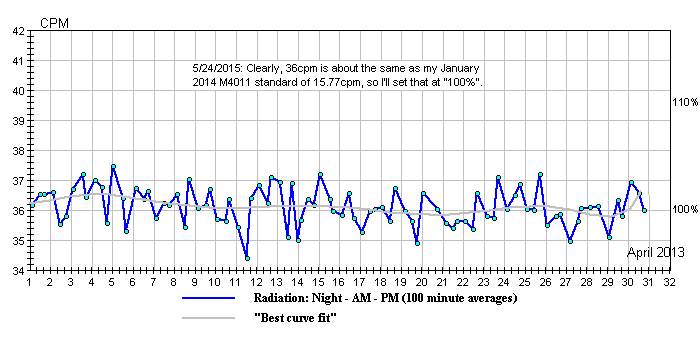
April 2013
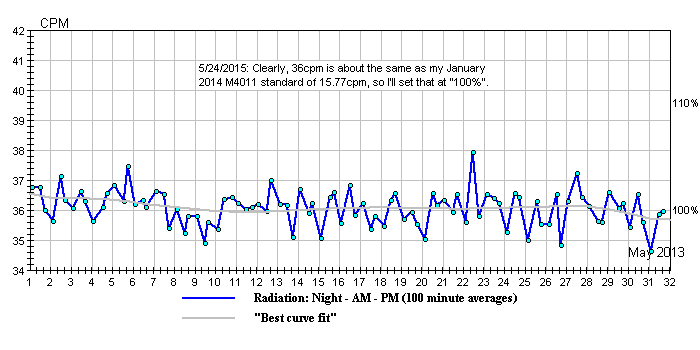
May 2013
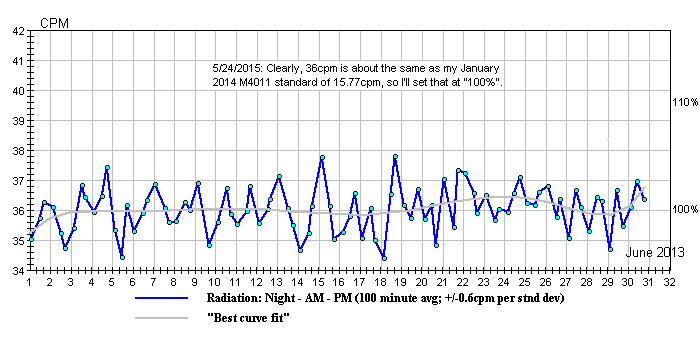
June 2013
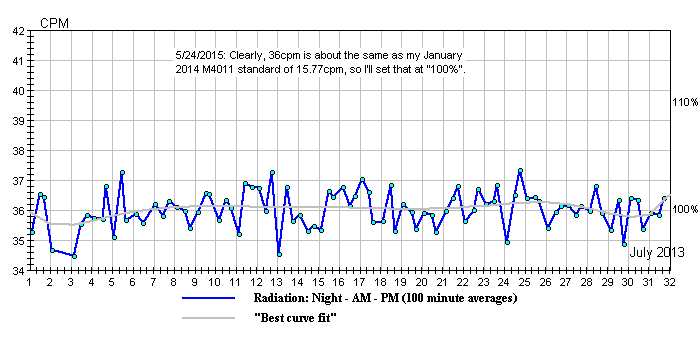
July 2013
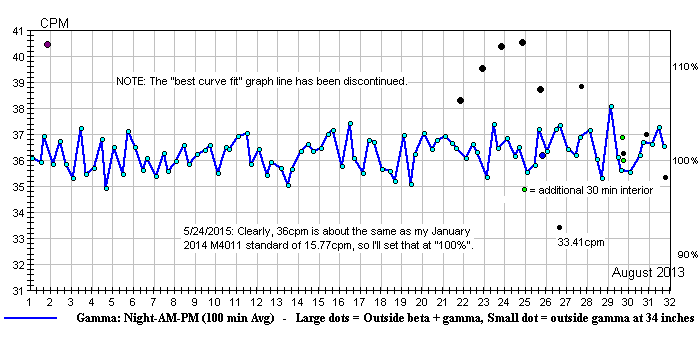
August 2013
1st: * See my notes about
elevation tests with a Geiger counter.
26th: * Those large dots are 100 minute
averaged readings made with my "Inspector" Geiger counter (sealed inside
a thin "ZipLoc" plastic bag). Note that the last dot is double, the lower
blue dot being the count with beta radiation blocked. The smaller black
dots are 26.66 minute Radex RD-1503 (SBM-20) averages, taken over a period
of about 30 minutes, expressed in "Inspector" (LND-7317) nominally "equivalent"
(for gamma) CPMs, for which totals, the standard error is +/-2.6cpm.
* It appears that the large black dot, 5-day whoop-de-do
on this graph is all about beta radiation --the stuff I wait for to go
away before testing my air filters for residuals. There was no rain
until until the 25th, so the invasive beta (radon daughters, presumably)
might have been driven out of all the sand around here by our sunny warm
days of late. (The 26th was especially warm, but also windy and dry.)
* On the 25th I ran inside and outside tests which included
using my old Radex-RD1503 Geiger counter. Like in the past, I saw
no increase when I took it outside (actually getting a slightly lower reading),
whereas the Inspector, with its mica window, reads about 11% higher in
the same location. This is most likely because the RD1503 is less sensitive
to beta radiation.
* It started raining again
while I was running the outside RD-1503 count, but there was no effect
upon the last 5 readings^. Nor did the rain and steady drizzle of the 25th
seem to affect the "Inspector's" readings.
^ The RD-1503 has neither a long count timer nor a data
port, so I have to take a reading every 3 minutes in order to build up
a longer average --than I can get from its native 160 second cycle. However,
it still seems stable and in calibration, so I'll use it for my outside
counts. (The exercise will do me good :-)) My purpose in this is to
possibly get an earlier warning, should fall-out or volatilized gamma emitters
from the beach begin accumulating. (We're fairly close to the bay and Pacific
ocean.)
* Note that the last big dot is double. The lower blue
one is the Inspector's average with beta blocked. Laying the beta blocked
"Inspector" Geiger counter on the ground gave nearly the same reading:
36.33cpm. Removing the beta shield ran it up to 44.37cpm (off the chart,
but that's mild, compared to some of the beta CPMs we read about elsewhere
after "rain-outs" (or "rain-ups" --not sure).
* Having reverted to placing my old Radex-RD1503 Geiger
counter out in the yard (34 inches above ground) for a 26.66 minute averaged
count, I'm multiplying the indicated "uR/hr" by 3.5 for a rough "Inspector"
Geiger counter equivalent.
* I deal with our radon CPMs to some extent when I
do air filter readings, recording the initial value and their signature
rate of decay.
28th: * No Radex outside check (small dot) today.
29th: * I ran the outside Radex Geiger counter (SBM-20
tube) check twice, once open, again with 1/8" aluminum shielding: no difference--but
that was anticipated, since past outside versus inside Radex checks showed
very little difference. After a series of bench tests with potassium chloride
and varying aluminum shielding, it appears that the Radex behaves as if
it has about .009" of aluminum shielding (over an imaginary mica window).
The
impression I get is of very weak (under 100KeV) beta at 34 inches off the
ground --which changes my gnotion of what "half value layer" (HVL) means
with respect to beta. I thought that the intensity of beta electrons was
only "depopulated" to 50% by an HVL (at whatever associated KeV), but that
the energies of the remnant beta stayed the same. (Obviously, gamma behaves
on the depopulation model, since passing light through a 0.3d (50%) neutral
density filter does not change its color, and since useful gamma
spectrometry can be performed on the radiation escaping (say) the large
cadaver of an ocean creature, or the living body of a "nuclear medicine"/imaging
patient.)
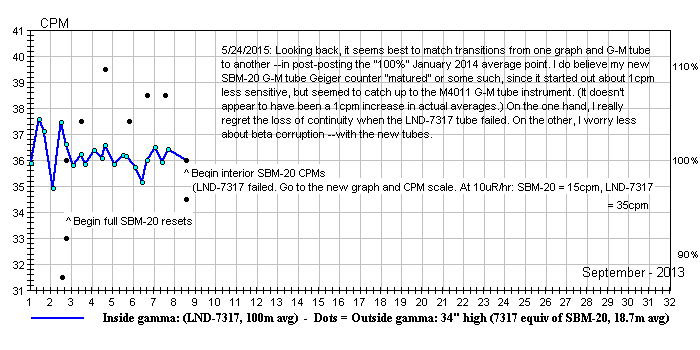
September 2013a
1st: * No Radex readings today.
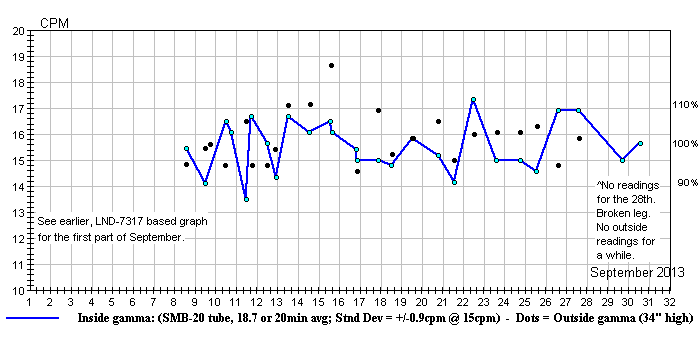
September - 2013b
* 8th: Added this 2nd September graph, based on SBM-20
Geiger-Mueller tube sensitivity --after the LND-7317 G-M tube in my Medcom
"Inspector" Geiger counter failed. An SBM-20 runs at 15cpm in a 10uR/hr
gamma field (from Cs-137), while an LND-1317 runs at 35cpm.
* 13th: A stray cat delivered 5 kittens under
our deck, which has been taking up a lot of time --getting them in, taming,
arranging for spay/neuter and adoption --so: my readings are down to little
more than once per day for a while.
* Please note that with the smaller tube and shorter
(cumulative) counting period, I've more than doubled the "noise"/jaggedness
of my graphing. The "standard deviation" is +/-0.9cpm (or let's say: +/-1cpm
--at an average of 15cpm) --and it shows.
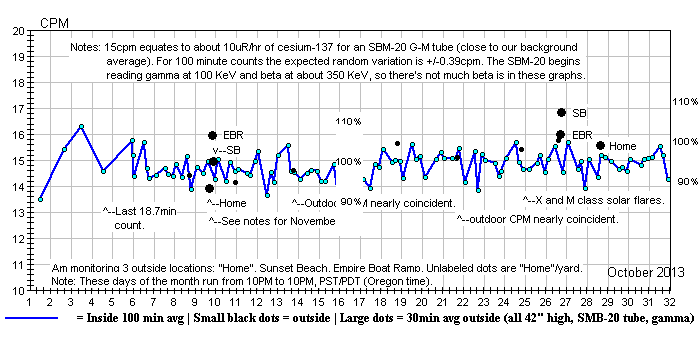
October - 2013
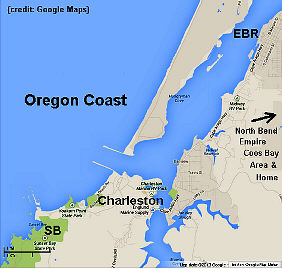
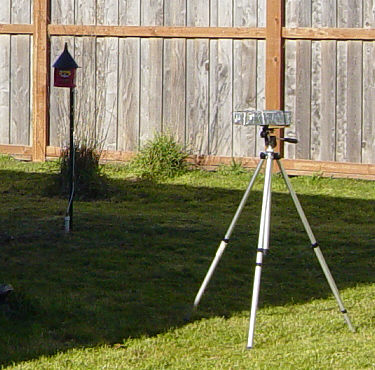
A map of our two field stations, our fixed outdoor Geiger counter and
our portable Geiger counter
*5th:
Was able to install a Russian SBM-20 G-M
tube in my failed Medcom "Inspector" Geiger counter. I've got about 43%
of the Inspector's original gamma sensitivity, plus I've lost the ability
to detect alpha and soft beta radiation --but I can once again do automatically
timed counts plus participate on-line with
Radiation
Network.
*9th: We selected two remote locations for 30
minute monitoring counts: 4.7 miles in from the mouth of Coos Bay (EBR
= Empire Boat Ramp) and two miles south of the mouth (SB = Sunset
Bay). We'll check these high tide spots throughout the year. (See 2015
entry, just below.)
*27th: Resumed doing periodic air filter monitoring,
but drawing about 4.4 cubic meters of air over 15 minutes --instead of
the old 10 cubic meter standard. The buildups in the filters were weak,
with 50% more CPMs (at about 2x background) in the draw taken 2 inches
off the ground, than in the filter drawn at 12 feet above ground level.
Of necessity, only a 10 minute initial reading, then another 40 minutes
later, were taken. Consequently, the possible errors were large, but the
decays were: to 69% (2 inch high draw) and to 43% (12 foot high draw) over
40 minutes.
*28th: Tested the two air filters of the 27th,
finding their gamma and hard beta radiation to be indistinguishable from
the background level.
*5/25/2015: Have mostly discontinued the remote
30 minute counts in favor of 2.7 minute averaged roving beach wanders (with
our dog Sammy). A shirt pocket Geiger counter (Radex RD1503) is set to
audible, so the ear sensitivity to anomalies adds considerably to the nominal
+/-16% sigma/standard deviation of the display (which is checked periodically).
Have added Bdrf = Bastendorff (just north of Sunset Bay).
**11/2/2020 update: The (Coos River) Chromium
mining/mill having shut down some years ago, I now only do "beach wanders"
at Bastendorff Beach (Sunset Bay being redundant). Instead of a long
count with a tripod mounted Geiger counter, these are 10 minute walks along
recent high tide "froth lines", listening for anomolous clicking indications
of any hot particles ("fuel fleas"), then recording the averaged CPM of
my gamma sensitive Geiger counter at about 30 inches above the sand. I
graph these counts as a percentage of what's been my base-line normal at
the house --for my SBM-20 tubed Medcom "Inspector" Geiger counter.
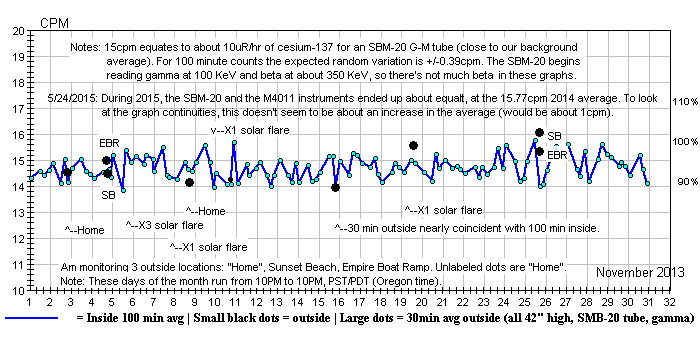
November - 2013
*EBR, SB and Home: see note on the October graph.
*28th: Ran an air filter
draw, finding the initial CPMs reading clearly at 4.5x background in the
test jig. The decay rate (to 73% at 20 minutes) had a radon daughter profile.
The filter read at background, 24 hours later.
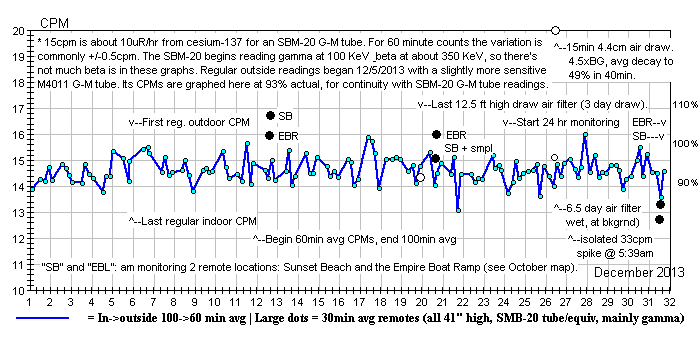
December - 2013
5th: * Began monitoring with the new outdoor station.
11th: * Began 60 minute counts at home (30 minutes
at remote Empire Boat Ramp and Sunset Beach stations).
16th: * Began 24/7 air sampling at low velocity
(1.36 cubic meter/day, instead of sporadic draws of 4.4 cubic meters in
15 minutes).
19th: * With the approach of winter storms and
continuous air sampling, the intake was lowered to 9.6 feet above the ground.
20th: * Have both a beach sand sample and 3 air
filters (1st low velocity and 2 old filters) on their way for gamma spectrometry.
24th: * The new outside monitoring station seems
stable. Will begin running it continuously on-line with Radiation Network.
26th: * Stopped 24/7 air sampling. Filter was
soaked from condensation.
* EBR and SB: see note on the October graph.
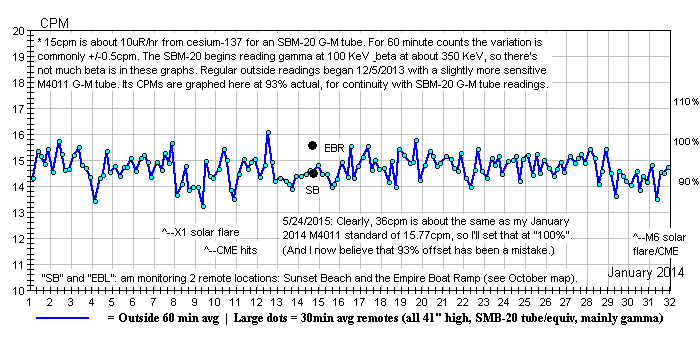
January - 2014a
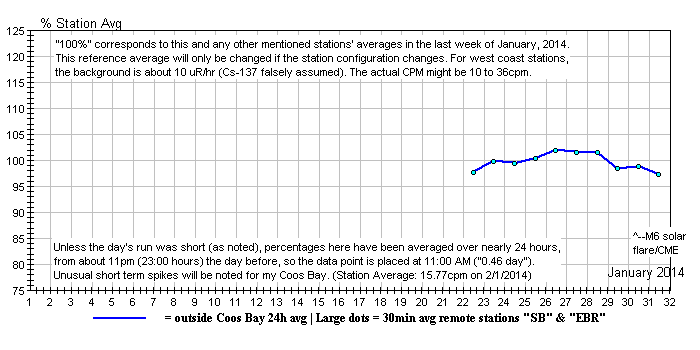
January - 2014b
11th: * I'm not satisfied with any of the graphing
modes I've tried (and see below).
22nd: * Did two 65 minute (19.1 cubic meter)
filtered air draws today, getting unusually high initial radon/daughter
readings (9x and 12x background) which decayed to 51% and 50% in 40 minutes
(gamma and hard beta only). They'll be examined with gamma spectrometry.
26th: * Air filter update.
The 9x filter checked
out as having no residuals. (Thanks, Tom.) We're still waiting for
a report on the 12x filter. (2/22: I never did get a final analysis
on the 12x, but the preliminary graph implied that the lab (not Tom's)
didn't have enough substance on the filter to get readings sufficiently
above background.
I thank both labs for having a go at my air filters
and I'll be quadrupling my air draws.)
29th: * I'll be going from 1 inch to 2 inch diameter
air filters here. I get about the same volume rate (limited pumping and
plumbing capacity) but the flow rate per square inch will be 25% as much
(better?) and the filter size is a better match to a 2" scintillator crystal.
30th: * There was no evidence of the M6 solar
flare today at 08:17 PST (16:17 UTC/GMT) in my minute-by-minute counts.
However, there was an isolated, 1 minute, greater than 4 sigma of 33cpm
at 07:35 today.
* I'll continue watching for and noting
any unusual short term spikes at my station. Unless grouped, isolated spikes
of less than 4 standard deviations/"sigmas" will be ignored, since 3 sigma
counts occur several times per day --by statistical probability alone.
At a station average of 16cpm, a 4 sigma spike would come in at 32cpm (by
my calculation).
February - 2014
* Days during which my minute-by-minute CPMs reached 33cpm
or higher: 2/1 (33), 2/12 (33), 2/13 (33), 2/14
(34), 2/16 (33).
22nd: * We had two dry sunny days in a row, so
I checked the beach stations and did a 40 cubic meter air draw, getting
what's apparently radon/daughters (40 minute half-life) with an initial
reading of 5x background.
23rd: * After 39 hours, the air filter read at
a normal background level. I'm sending this filter to Tom's lab for
gamma spectrometry.
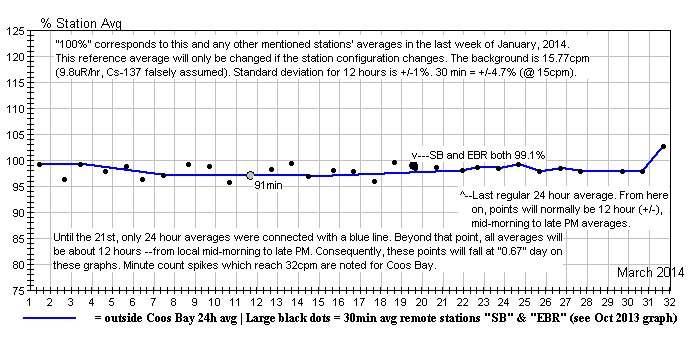
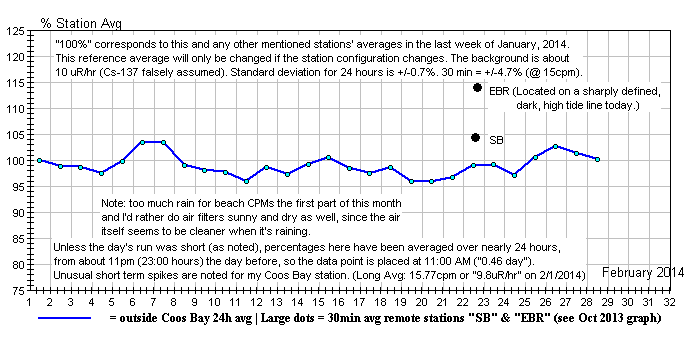
March - 2014
2nd: * Began adding 12 hour daytime though evening
averages as unconnected small black dots. (Might not catch every day's
count.)
13th: * An isolated single minute count of 33
at 21:42 hours.
20th: * An isolated single minute count of 33
at 11:19 hours.
22nd: * Gave up on 24 hour averages (as being
not much different than 12 hours) and went to all 12 hour --and all connected
on the graph.
28th: * Whoops: shut down the computer before
I saved my CPM data --but it was running 15-something, per usual. (My dog's
fault! :-)
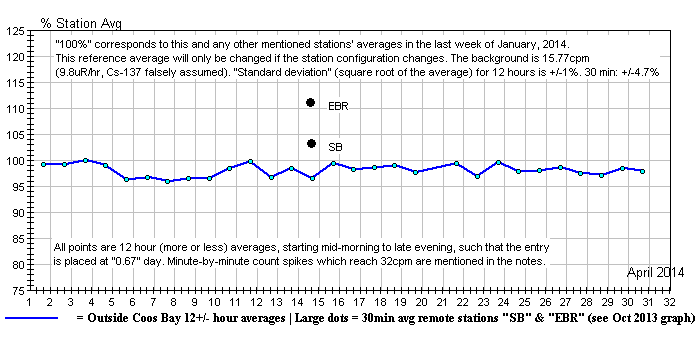
April - 2014
13th: * There was an isolated one minute count of
32 at 20:34 hours PDT. Presumably, this was a random high (re: "Poisson
distribution").
14th: * A rather high reading at the Empire Boat
Ramp today, but not at Sunset Beach. EBR was higher in February as well.
* "100%" was (arbitrarily) normalized to the last week
in January --which appears to have been a few percentage points higher
than the annual normal average. I'll stick with it never-the-less.
15th: * There was an isolated one minute count
of 33 at 14:17 hours PDT.
16th: * There was an isolated one minute count
of 34 at 19:49 hours PDT.
20th: * Whoops: forgot to turn the data logging
program on today --sorry.
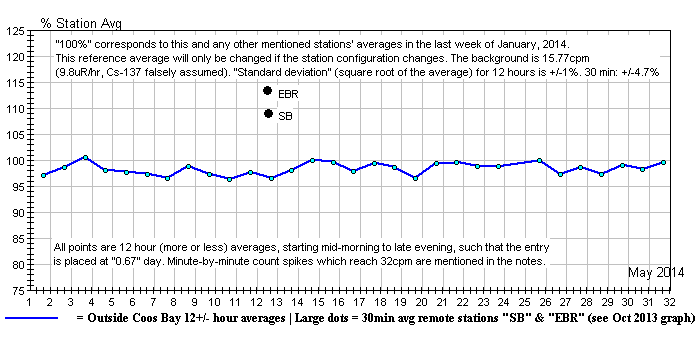
May - 2014
9th: * There was an isolated 32cpm one minute spike
at 23:45 hours PDT.
12th: * Got another high reading at the Empire
Boat Ramp today --though not a record, and Sunset Bay was fairly high as
well. Both readings were above clearly delineated (by detritus and seaweed)
high tide/wave wash lines.
* Again: I originally expected
Sunset Bay to be higher, since it opens upon the ocean --particularly
as we anticipate the Fukushima plume's arrival. It might be that the Empire
Boat Ramp station (4.7 miles up into the outflow of the Coos River) is
located on dredgings which happen to be more radioactive. Another possibility
is forest run-off, abandoned and current mining operations further up the
river.
* I'm torn as to whether I should always station on
the same maximum tide line spot, or follow the most recent/apparent high
water line as it advances and recedes. If I keep so moving the station,
I might cross a vein of thorium rich sand and get a false impression about
encountering evidence of the Fukushima plume. What's your opinion?
* I also did an air draw today. It was supposed
to be 2 hours (40 cubic meters), but I drifted off to sleep and it ended
up being a 140 minute draw (47 cubic meters). The initial N95 filter activity
was fairly low (4.4x background) and it decayed at a classical radon daughter
rate (to 48% in 40 minutes, counting gamma and beta only). After 49 hours,
the filter checked at background, so there were no residuals that I can
detect.
16th: * There was an isolated 33cpm one minute
spike at 15:06 hours PDT.
18th: * No birds at the feeders this morning --very
unusual, but has happened once before. We normally have 15 to 20 pigeons
and dozens of chirping small birds (sparrows, blackbirds, cow birds, crows).
They must have come later, but not enough of them to scour the bottom of
the elevated small bird feeder.
19th: * Up to 15 pigeons trickled in, but initially,
no small birds again.
22nd: * There was an isolated 32cpm one minute
spike at 09:01 hours PDT. (Will begin noting spikes at 33cpm after this
entry.)
24th: * Sorry! I flat forgot to turn the data
logging on today.
* Back to normal on pigeons, small birds still
somewhat diminished.
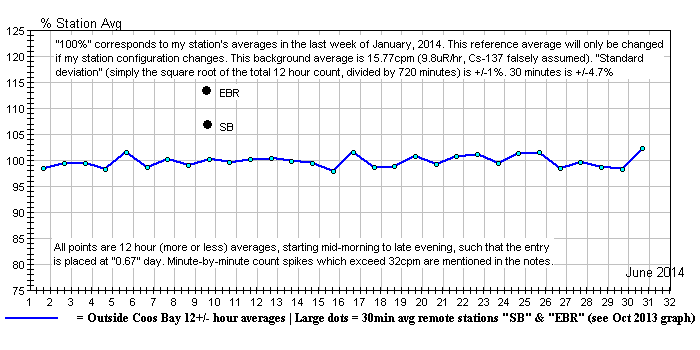
June - 2014
05th: * No pigeons, sufficient small birds at the
feeder.
06th: * 6 pigeons, sufficient small birds
at the feeder.
07th: * 12 pigeons, normal number of small birds.
10th: * Pigeon and small bird count back to normal.
(Turns out a family of feral cats moved in.)
* Did an air draw today: 40 cubic meters. The
initial N95 filter activity was quite low (1.7x background). After 24 hours
the filter checked at background, so there were no residuals that I could
detect.
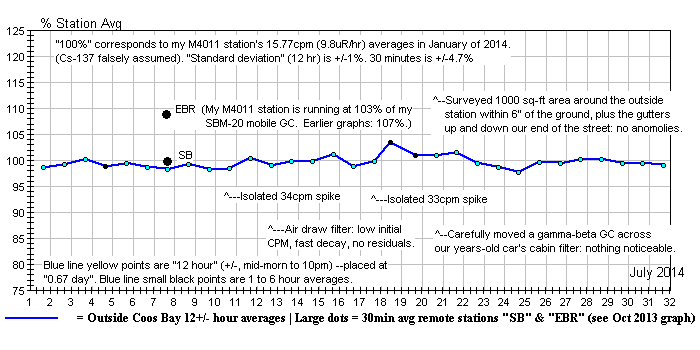
July - 2014
10th: * There was an isolated 34cpm one minute spike
at 12:02 hours PDT.
12th: * Did our monthly 40 cubic meter air draw
--through a small N95 filter. The initial CPM was exceptionally low: 56%
above background, which then decayed exceptionally fast --to 15% in 40
minutes --perhaps because my deviation errors ganged up on me this time.
(I'll try to get this air draw data onto the above graph, which will be
periodically posted to: http://radviews.com.)
27th: * Isolated 34cpm spike at 10:37 hours PDT.
August - 2014
September - 2014
October - 2014
November - 2014
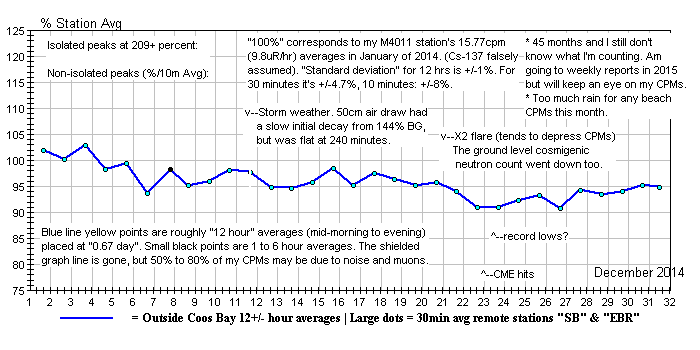
December - 2014
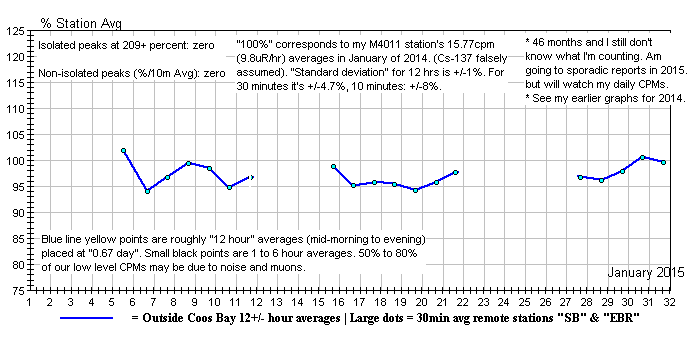
January - 2015
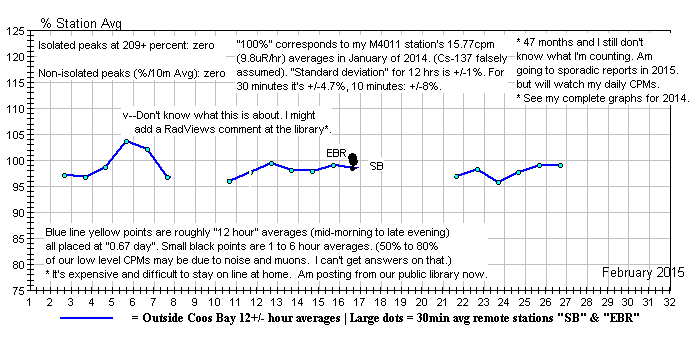
February - 2015
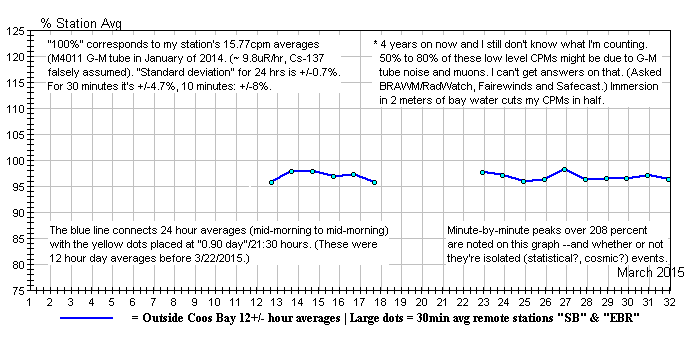
March - 2015
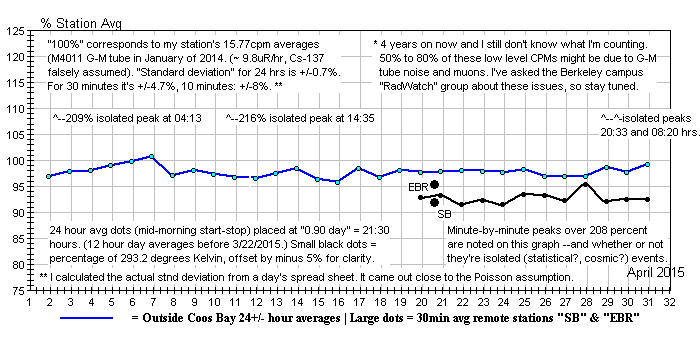
April - 2015
% deviation from 293.2o Kelvin G-M tube temperature
(-5%) from 4/19/2015
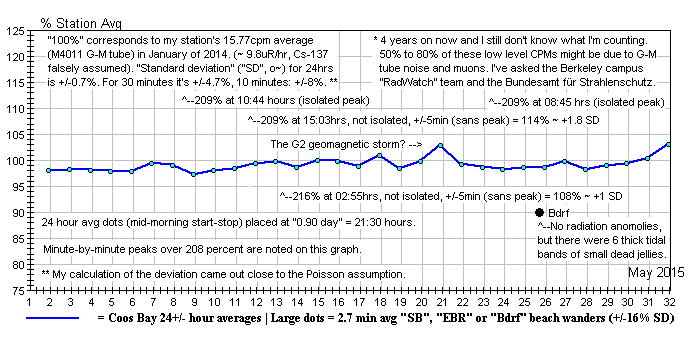
May - 2015
5/25b: * I've discontinued my remote
station 30 minute beach and bay counts in favor of "beach wanders"
(with our dog Sammy), while carrying a beeping Radex-RD1503 in my shirt
or jacket pocket (for pretty much of a gamma count only). While the display
count is only averaged over the previous 160 seconds --for a whopping standard
deviation of +/-16% (+/-2.5cpm), the ear is oddly more sensitive to changes
than that would suggest. The advantage is in greatly expanding the area
I'm monitoring, but only for detecting something gross --like "hot particles"
or a hot object, since there'll no longer be a fixed station base line.
However: should I log a significant average increase or an anomaly, I'll
do a better count. I've added station Bastendorff ("Bdrf")
--between
Sunset and the Empire Boat Ramp.
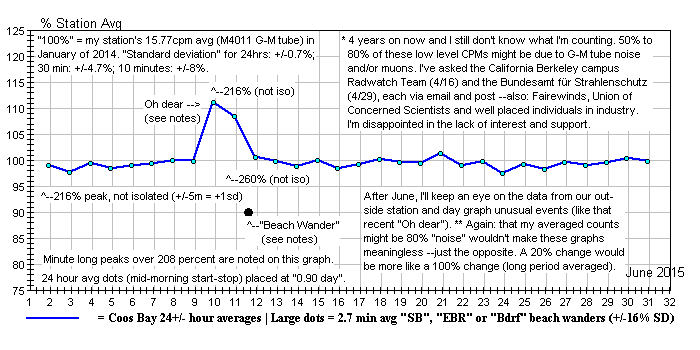
June - 2015
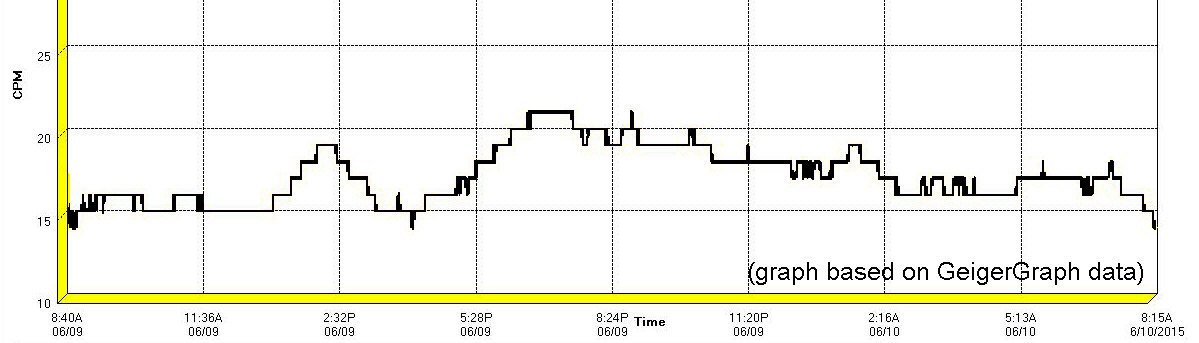
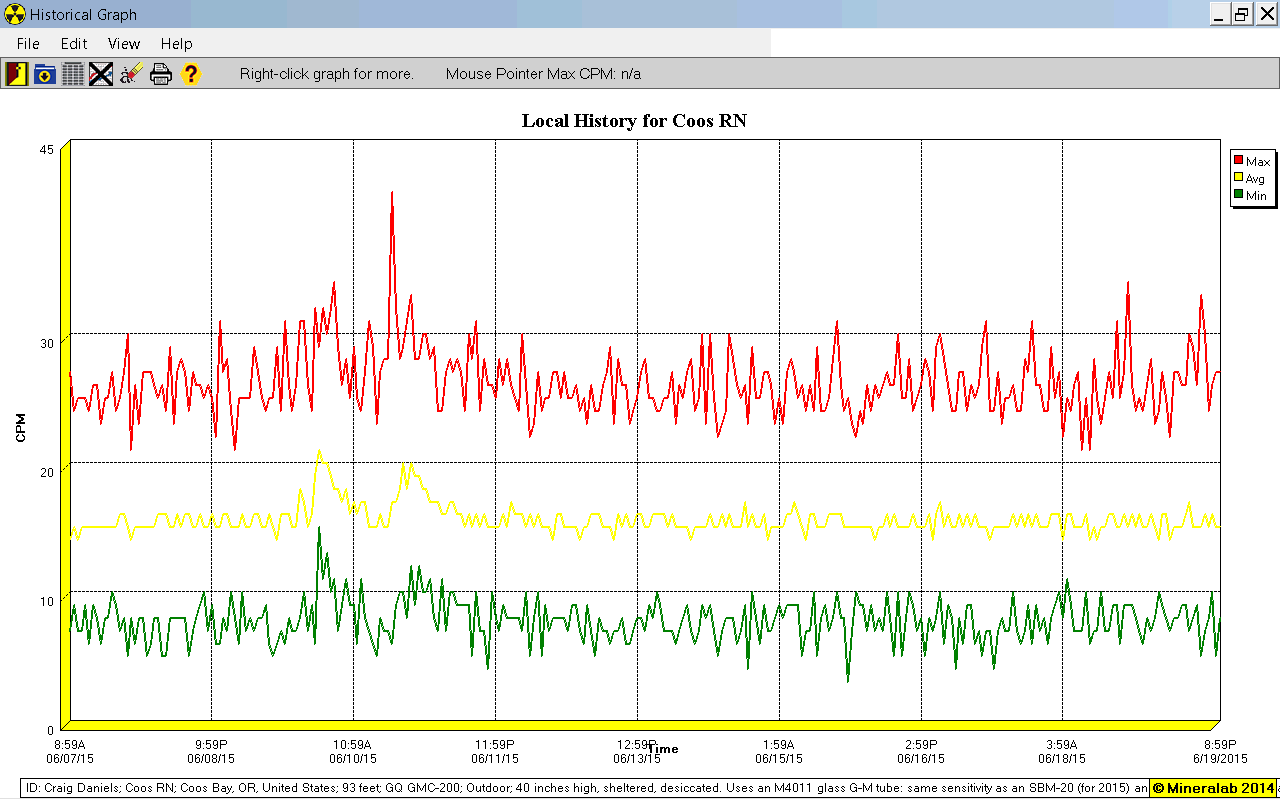
6/9b: * I don't know what these peaks are about,
but that 24 hour average is a whopping 17.7 standard deviations ("sigma")
over the 15.77cpm norm here (at least: the way I figure it). As shown
below, the day's 60 minute averages, 10 minute averages and one minute
counts are no slouches either. (Ctrl+ to enlarge the images.)
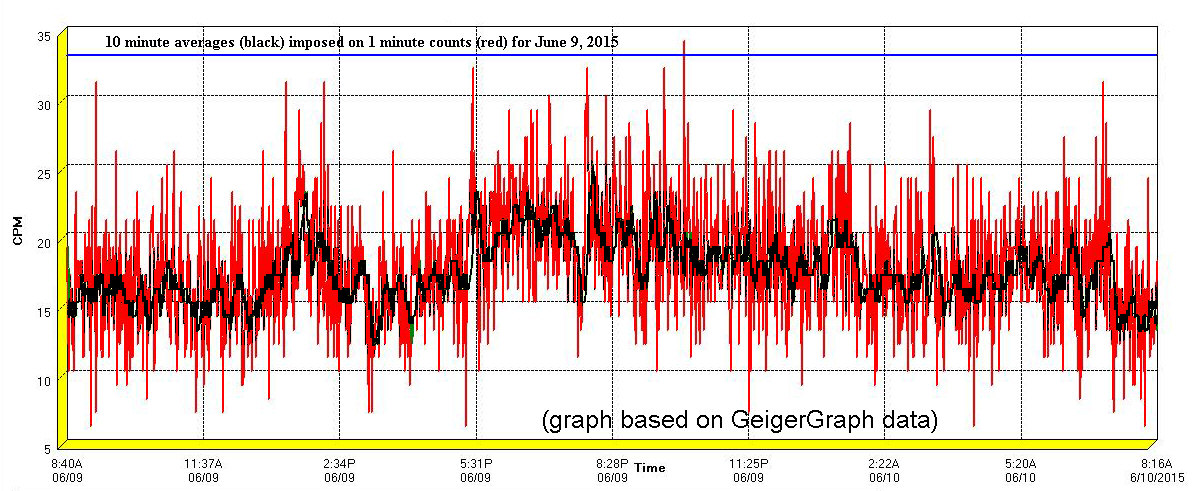
One and Ten Minute Averages on June 9th, 2015
(Ctrl+ to enlarge the images.)
Hour-long averages on June 9th, 2015
(I'm guessing this is a rounded running average.)
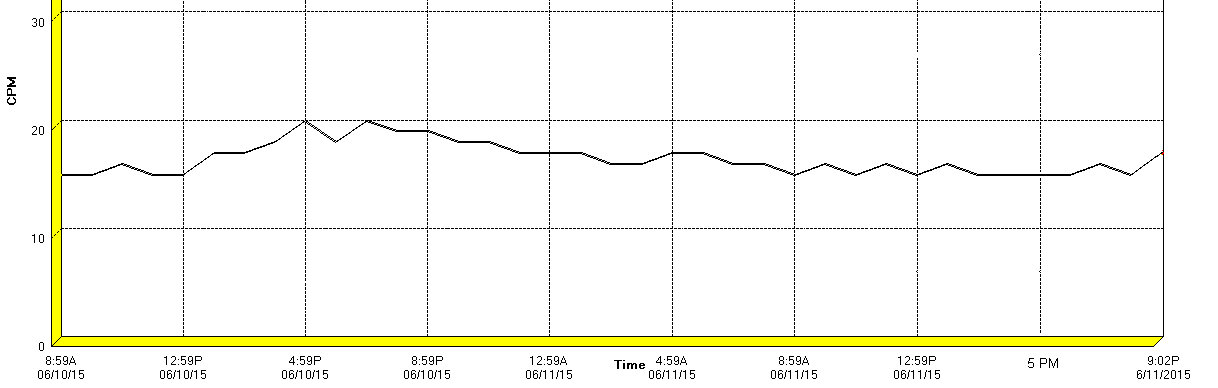
Hour-long averages on June 10th, 2015
(This appears to be an hour-by-hour straight average,
based on a different output of GeigerGraph data.)
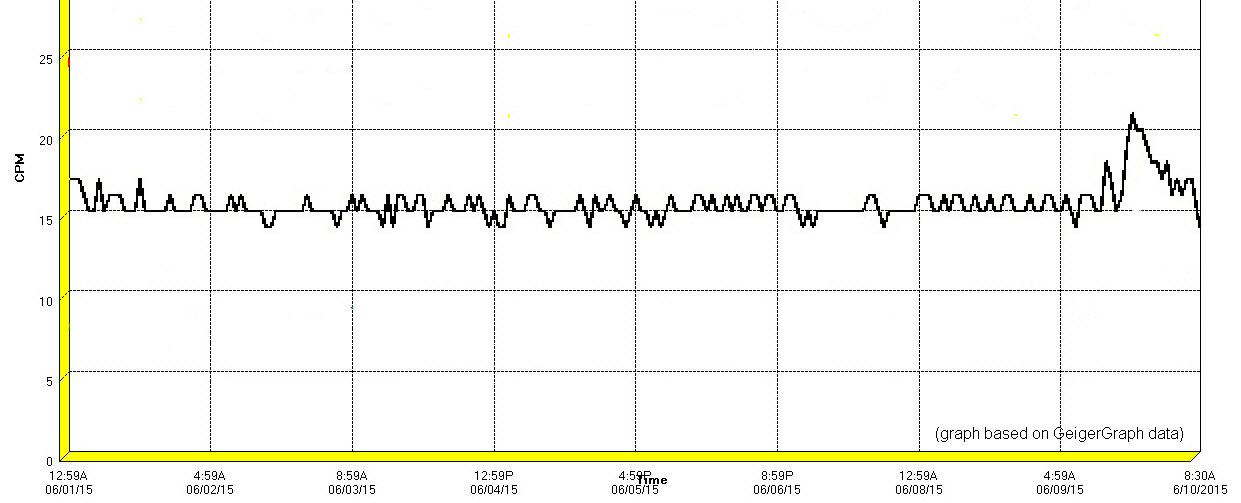
Hour-long Averages, June 1st through 9th, 2015
6/10c: The high count experience here seems to have
been isolated to my station. Judging by the period of hours that it appeared
to last, I speculated that I was picking up radiation from a neighbor who'd
been given a radioactive tracer injection (ie: "nuclear medicine"), although
I have no confirmation of that.
6/11: * Okay --I'm stumped. Assuming this
is about a neighbor who's been given a medical dose of a radioactive tracer
substance, a second day of high CPMs suggests that it can't have been 6
hour half lived technetium-99m (which is rapidly eliminated from the body).
Possibly, the tracer was iodine-131, but for all I know, my elevated CPMs
were caused by something else altogether.
* I compared my regular Geiger counter to one which use
to match its counts fairly well (long term averages), and found it about
5% higher now. Since my graphs have otherwise been looking consistent,
I'm saying that the 2nd Geiger counter was 5% low --for some reason.
* I did a 4 loop "beach wander" today, since there's so
much in the (Ene) news about ocean contamination, but my readings were
normal --and I was listening to the beeps as I walked. (I saw the same
bands of --what I take to be-- small, dead, paper thin jelly fish --as
before.)
6/16: How to log and graph such a rough and casual
reading is a problem. Tentatively, I'll average the displayed range of
readings and "round up" to the nearest 10% --as looked at and informed
by the audible beeps.
Sorry: Save for an active period late in November, I got
discouraged and stopped graphing --until 2016, preserving only my logged
notes for unusual peaks/events (as follows). However, the logging program
I've been using (an old beta version of GeigerGraph-5) can be set to generate
an hourly averaged graph for that period (shifted about 8 hours
on 10/10/2015, when I went to UTC time) with overlap in June for comparison:
--which you'll have to Ctrl+ to enlarge the images
and read the legends. (PDT time)
That period of interest in June (PDT time).
July - 2015: * There were isolated (ie: no preceding
build-ups nor follow-on decays) one minute long peaks on the 4th (33cpm),
the 8th (34cpm), 25th (33cpm), but the days of July otherwise looked normal.
August - 2015: * There were isolated 33cpm
(minute-long) peaks on August 21st, 23rd, 26th, and 28th. We logged isolated
34cpm peaks on the 22nd and the 26th as well. Those peaks were statistically
unsurprising and the rest of August has been within our normal
range.
(I'll try
to make my reporting more uniform.)
September - 2015: * We logged peaks as follows:
~33cpm at 08:37 hours (all PST)
on 9/7
~33cpm at 20:22 hours on 9/9
~34cpm at 07:20 hours on 912
~33cpm at 00:22 hours on 9/16 (The
10 minute running avg hit my reporting threshold of 20cpm 00:30h)
~The 10 minute running avg hit
my reporting threshold of 20cpm on 9/20 at 12:00 hours
~34cpm at 11:25 hours on 9/22
~34cpm at 12:23 hours on 9/24 ,
and on the 20th at 12:00 hours.
~37cpm peak on 9/24 at 13:50 hours
--a
bit unusual
Other than those of the 24th, September's peaks were
isolated (ie: no preceding build-ups nor follow-on decays) and statistically
unsurprising. The rest of September was within our normal
range.
October - 2015: * I'm reading responsible
reports that cesium-137 is showing up in Alaskan waters.
* As of 10/10/2015 I standardized on Co-ordinated Universal
Time, or "UTC" --which is similar to GMT", but sans any DST changes. I
should have been doing this since March of 2011. (We need to don pirate
costumes and form a rabid, single issue political faction which is hell
bent on abolishing our absurd Daylight Saving Time clock changes --!--
Arrrrrr!)
* As of 10/31/2015, logging here has been within
our normal range, with isolated peaks (ie:
no preceding build-ups nor follow-on decays) as follows:
~33cpm peak at 17:30 hours on 10/2
~34cpm peak at 20:49 hours on 10/9
~34cpm peak at 09:33 hours on 10/10
(Switched to UTC time-dates)
~33cpm peak at 06:13 hours on 10/25
(10 minute avgs reached 20cpm 4 times --otherwise isolated.)
~33cpm peak at 00:19 hours on 10/26
November - 2015: * As of 11/30/2015,
and except for a double-peaked 10 minute running average excursion on the
30th (to 22cpm, but 1 minute peaks did not reach 33cpm), logging here has
been within our normal range, with isolated peaks
(ie:
no preceding build-ups nor follow-on decays) as follows:
~The log for the day of 11/2 was
somehow lost.
~The 10 minute running average
reached my reporting threshold of 20cpm at 08:30 hours on 11/4.
~The day's 24 hour average was
15.64cpm on 11/10 (The 7-day average ending 1/31/2014 was 15.77)
~The 10 minute running average
reached 20cpm at about 01:39 hours on 11/15.
~The 10 minute running average
reached 20cpm at about 16:15 hours on 11/17.
~33cpm peak at 10:30 hours on 11/18
~On 11/20 I started saving images
of the daily graph (to the default directory for GG-5b).
~The 10 minute running average
reached 22cpm at about 17:00 hours on 11/20.
~35cpm peak at 10:46 on 11/22.
~The 10 minute running average
reached 20cpm at about 05:30 hours on 11/24.
~The 10 minute running average
reached 23cpm at about 20:00 hours on 11/24.
~The 10 minute running average
reached 20cpm at about 09:30 hours on 11/25.
~33cpm peak at 12:51 hours on 11/25.
~34cpm peak at 23:50 hours on 11/26.
~The 10 minute running average
touched 20cpm 3 times on 11/29.
~The 10 minute running average
touched 20cpm 3 times on 11/30 --once to 22cpm, but no 33cpm 1-min peaks.
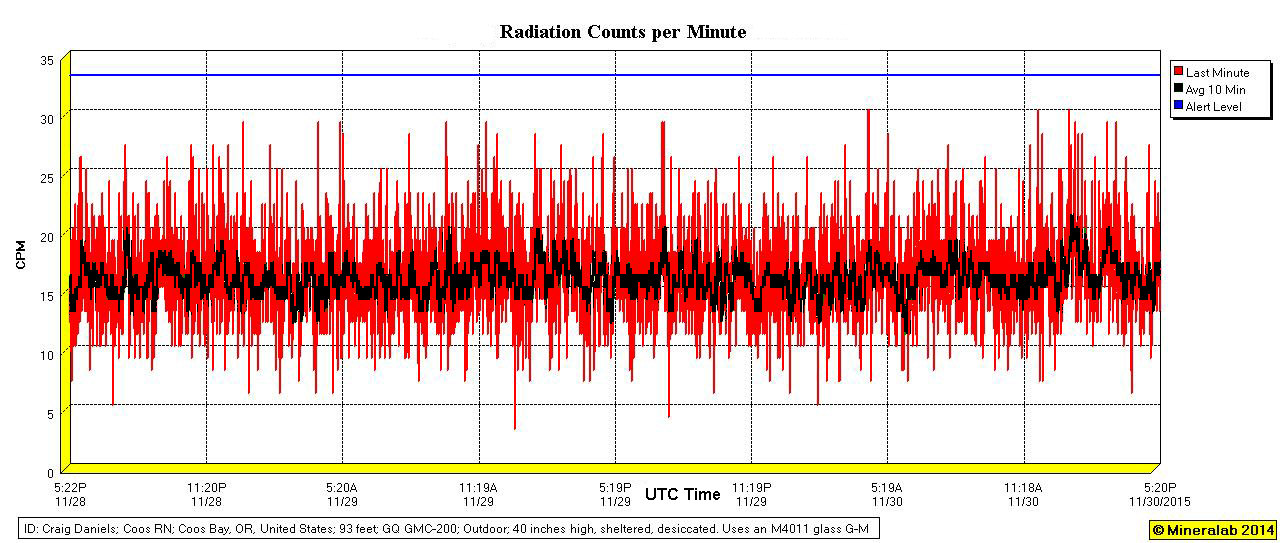
11/28-11/30/2015utc (Ctrl+ to enlarge the images.)
December - 2015: * As of January
1, 2016, logging here has been within our normal range,
with isolated peaks (ie: no preceding build-ups
nor follow-on decays) as follows:
~34cpm peak at 15:12 hours on 12/1.
~The 10 minute running average reached
20cpm at about 13:00 hours on the 4th.
~The 10 minute running average reached
20cpm at about 18:00 hours on the 6th.
~The 10 minute running average reached
22cpm at about 14:30 hours on the 8th.
~The 10 minute running average reached
21cpm at about 16:00 hours on the 10th.
~The 10 minute running average reached
20cpm at about 09:00 hours on the 11th.
~33cpm peak at 00:56 hours on 12/17.
~The 10 minute running average reached
20cpm at about 05:15 hours on the 18th.
~On 12/24, I started logging (but I'll
usually not post) the 24 hour average for each day. I'm also saving the
daily graphs. The first averages have been: 15.75, 15.12, 15.38, 15.33,
15.17, 15.44, 15.39, 15.20 (through 12/31). these average 15.35cpm, whereas
the last week of January, 2014 averaged 15.77 (with the same outside-inside
equipment and configuration).
~33cpm peak at 20:43 hours on 12/26.
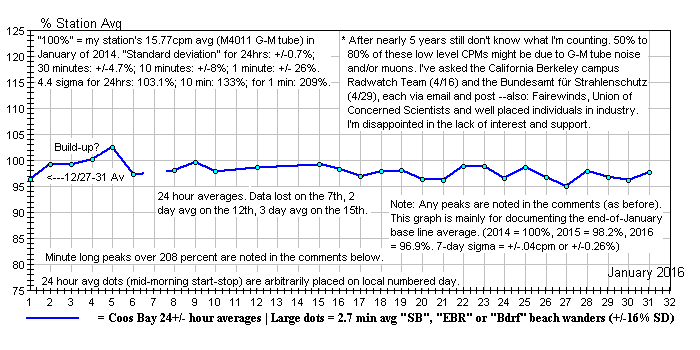
January - 2016
* All times/dates UTC. As of January 19, logging here
has been within our normal range, with isolated peaks
(ie:
no preceding build-ups nor follow-on decays) as follows:
~4th: The 10 minute running average reached
20cpm at about 23:15 hours.
~5th: The 10 minute running average reached
20cpm at about 13:15 hours.
~Somehow, the program shut down on the
6th, so I lost the data for the 6th-7th period.
~7th: The 10 minute running average reached
20cpm at about 17:50 hours.
~7th: 33cpm peak at 18:10 hours.
~9th: The 10 minute running average reached
23cpm at about 18:17 hours.
~12th: The 10 minute running average
reached 20cpm at about 17:00 hours.
~15th: 33cpm peak at 01:44 hours.
~17th: 33cpm peak at 08:07 hours.
~18th: 33cpm peak at 05:09 hours.
~19th: 33cpm peak at 11:38 hours.
~No 4.4+ sigma peaks through to the 31st,
and the averages are running low.
* I'll continue to base percentages on year 2014 being
100% (15.77cpm).
* Why do the 1 and 10 minute averaged levels of 33-34cpm
and 20cpm repeat so often? This has to be some sort of an event with an
irregular but frequent recurrence. I checked the USGS "Real-time earthquake
map" (via the R-G Oregon Live Link) and tallied 9 small earthquakes spanning
the past 30 days --within a radius of about 130 miles (land and ocean).
None of them came even close to the UTC timed peaks on this page.
* Perhaps I can get some regional magnetometry to match
up.
* We've recently had a few frog drowning rainfalls,
but with no marked effect upon the gamma counts that I can see. Perhaps
if I compared rainfall rates to the rolling 10 minute
averages, I could see some match-ups.
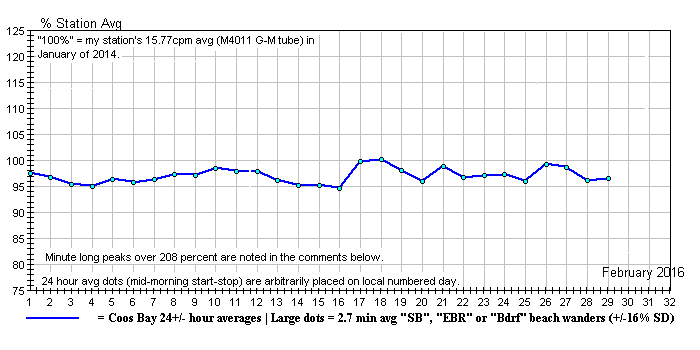
February - 2016
* All times/dates UTC. As of February 17, logging here
has been within our normal range, with isolated peaks
(ie:
no preceding build-ups nor follow-on decays) as follows:
~2nd: The 10 minute running average reached
21cpm at about 05:00 hours.
~2nd: 32cpm peak at 21:07 hours, noted
because it was such a stand-out peak (although less than 33cpm).
~3rd: The 10 minute running average reached
20cpm at about 19:30 hours.
~I stopped saving daily graphs as of
the 3rd.
~9th: The 10 minute running average reached
20cpm at about 20:15 hours.
~15th: 33cpm peak at 06:29 hours.
~The daily average fell to 94.6% on the
16th, so I decided to do a graph for the month of February as well --and
to corroborate January's low average. Past graphs have dipped as low as
91%, however. There's been one power failure (a broken wire) and time will
tell if this is about the (sealed in with the Geiger counter) backup battery
running down, but I don't think so.
~17th: Noted: an abrupt increase of 5.2%
in the daily average.
~18th: The 10 minute running average
reached 20cpm at about 15:15 hours.
~21st: The 10 minute running average
reached 20cpm at about 14:15 hours.
~23rd: The 10 minute running average
reached 20cpm at about 07:00 hours.
~Oddly, that 10 minute average "ceiling"
pretty much continues.
~No other notable excursions through
the end of this month.
~The last 7 days of February averaged
97.3% --a tad higher than the last 7 days of January.
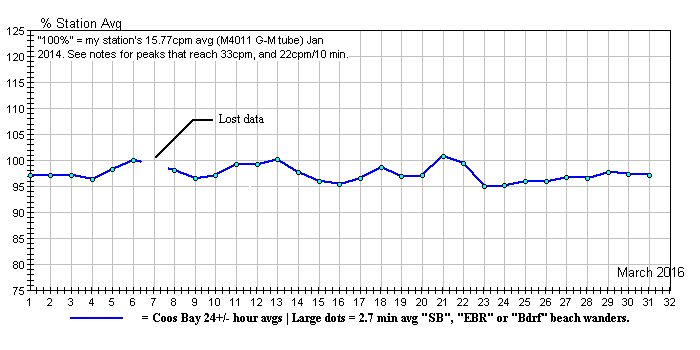
March - 2016:
* As of 4/1/2016, logging here has often been below
our normal range, with isolated peaks (ie:
no preceding build-ups nor follow-on decays) as follows:
~ 5th: The 10 minute running average
reached 20cpm at about 22:10 hours.
~ 5th: 33cpm peak at 21:58 hours. (A
brief decay, but no build up. Saved the graph.)
~ 7th: Found the logging program stopped.
Rebooted the OS.
~12th: The 10 minute running average reached
20cpm at about 12:15 hours.
~19th: 36cpm peak at 04:23 hours. (No build
up, brief 10m avg plateau at 18cpm.)
~20th: The 10 minute running average reached
20cpm at about 06:00 hours.
~21st: The 10 minute running average reached
20cpm at about 12:00 hours. (isolated)
~21st: The 10 minute running average reached
20cpm at about 18:30 hours. (isolated)
~22nd: 33cpm peak at 03:04 hours. (The average
over the past 3 days: 15.51 = 98.35%)
~23rd: This day's average fell to 14.98cpm
= 95% --the 3rd such low this year.
~24th: Only got the last 12 hours of this period
(forgot to restart the logging program in the morning).
~29th: The 10 minute running average reached
20cpm at about 15:45 hours.
~30th: The 10 minute running average reached
20cpm at about 10:50 hours. (isolated peak)
~30th: The 10 minute running average reached
21cpm at about 11:20 hours. (isolated peak)
~31st: The last 7 days averaged 96.8% of this
station's 2014 baseline (100% = 15.77cpm).
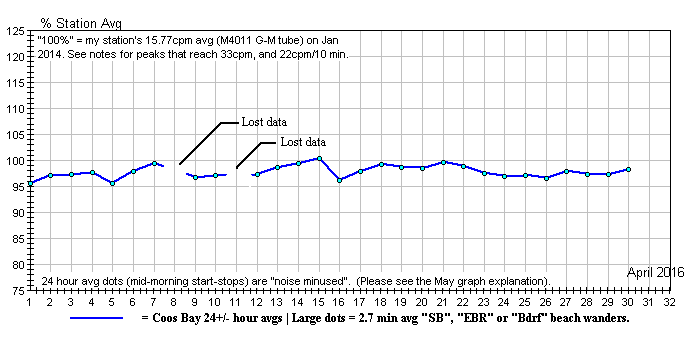
April - 2016:
* The following comments are based on whole counts.
* As of 5/1/2016, my counts have been trending back
up toward our
normal range, with isolated peaks (ie:
no preceding build-ups nor follow-on decays) as follows:
~ 2nd: The 10 minute running average
reached 20cpm at about 04:30 hours.
~ 7th - 8th: I found the GG-5 logging
program off. Rebooted the operating system.
~10th: 32cpm peak at 14:30 hours. (From
graph only. GG-5's SS overwrote data after the 3rd day.)
~14th: The 10 minute running average reached
20cpm at about 06:40 hours.
~15th: 32cpm peak at 01:46 hours.
~17th: 32cpm peak at 00:42 hours, and again
at 02:30 hours.
~22nd: The 10 minute running average reached
20cpm at about 16:15 hours.
(I don't know why the 10 minute count is so often 20cpm.)
~30th: The rest of April was "low" to "average"
with no one or ten minute peak reaching levels of note.
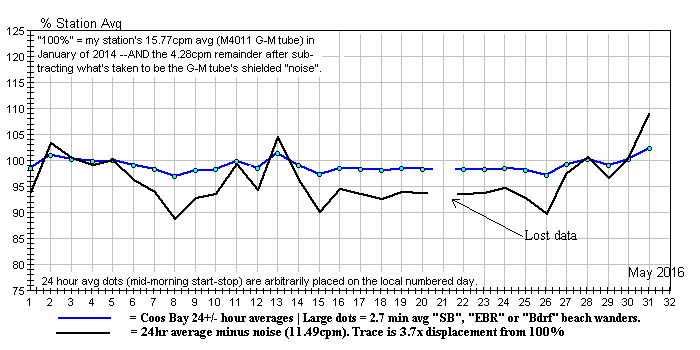
May - 2016
A comparison of straight counts logging to my (brief)
"minus noise" logging.
* As of 6/1/2016, my counts have been trending back
up toward our
normal range, with peaks (one
of which appeared to be a build-up and decay) as follows:
~ 1st: 33cpm peak at 20:24 hours (UTC).
~ 3rd: The 10 minute running average
reached 20cpm at about 10:00 hours.
~ 6th: 32cpm peak at 16:30 hours.
~ 8th: The 10 minute running average
reached 21cpm at about 00:30 hours.
~ 8th: 33cpm peak at 03:52 hours.
~10th: The 10 minute running average reached
20cpm at about 15:00 hours.
~10th: 33cpm peak at 22:17 hours.
~11th: 32cpm peak at about 10:45 hours.
~13th: 34cpm peak at 06:06 hours.
~13th: The 10 minute running average reached
20cpm at about 13:15 hours.
~14th: 32cpm peak at 11:17 hours.
~14th: Another 32cpm peak at about 14:30 hours.
~17th: The 10 minute running average reached
20cpm at about 12:45 hours.
~20th: Found my logging program stopped and
data lost for the day. Rebooted OS.
~21st: 32cpm peak at 19:25 hours.
~21st: The 10 minute running average reached
20cpm at about 19:40 hours (almost a decay from that 32 peak,
but looks more like a coincidental stand-alone). Saved graph and SS.
~23rd: The 10 minute running average reached
20cpm at about 06:45 hours.
~24th: 33cpm peak at 06:22 hours.
~25th: 32cpm peak at 13:20 hours. (Saved SS
& graph.
Submersion tests today.)
~28th: A 33cpm peak at 15:24 hours, surrounded
by a brief build-up and decay --which amounted to a 10 minute
running average peak of 21cpm at about the same time. Although these peaks,
alone, are barely
remarkable, a "build-up and decay" is unusual enough to take note of (if
not graph).
~30th: The 10 minute running average reached
20cpm at about 22:05 hours. (Today's average reached 100.1%)
~31st: The 10 minute running average reached
20cpm at about 08:15 hours. (Today's average reached 102.4%. )
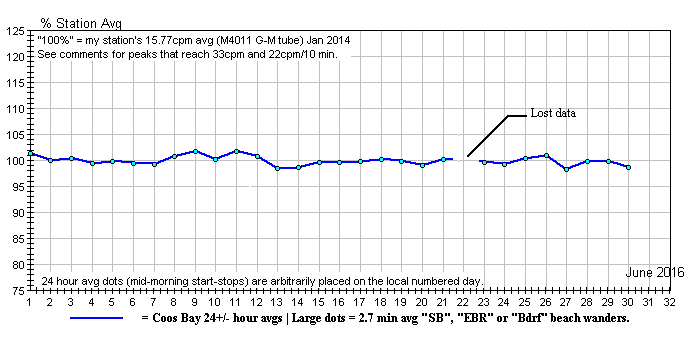
June - 2016
(Apologies: This graph evaporated for a few days.)
* My notices of higher peaks were growing rather lengthy
--now that "background" radiation counts are returning to the 2014 baseline
average (15.77 = 100%), I've arbitrarily raised the bar --to a whole count
of 22cpm for 10 minute running averages (140% of baseline), and to
a one minute count of 33 (209% of baseline).
* G-M tube mid-level energy gamma efficiency might
only be about 2%, but G-M tubes will continue to count up into Cosmic energy
levels (well above scintillator levels) so G-M tubes might have good response
to muons (flux ~ 1/cm^2/minute, they carry charge & are some 200x the
mass of an electron, so the shielded noise count seems about right, given
the profile of an LND-7317 G-M tube). An argument against: they're relativistically
fast enough to only be perceptually present --and don't hang around long
enough to ionize G-M tube gas. (Muons collide with and get amplified by
lead shielding due to secondary splatters --to the extent that counts can
go up with over 100mm of shielding.)
~ 9th: The 24 hour run ending today averaged
101.8 percent.
~10th: 33cpm peak at 12:32 hours (UTC).
~11th: The 24 hour run ending today averaged
101.8 percent.
~18th: A 33cpm peak at 06:50 hours.
~18th: A 33cpm peak at 07:17 hours.
~22nd: Found my logging program stopped and
data lost for the day. Rebooted OS. Due to the increasing
frequency of my logging program crashes, I'm scheduling OS reboots every
8 days now.
~30th: Above times UCT/GMT. No further threshold crossing
peaks to report, as of this (PST) morning.
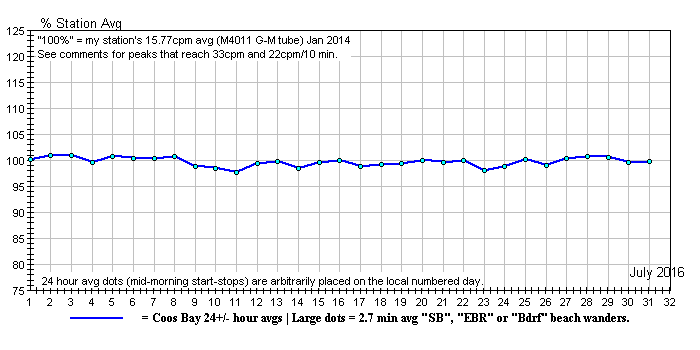
July - 2016
~ 2nd: 34cpm peak at 10:15 hours (UTC). (Isolated)
~ 2nd: 35cpm peak at 14:43 hours. (Isolated)
~15th: 35cpm peak at 02:45
hours. (Isolated, but saved automatic day graph anyway.)
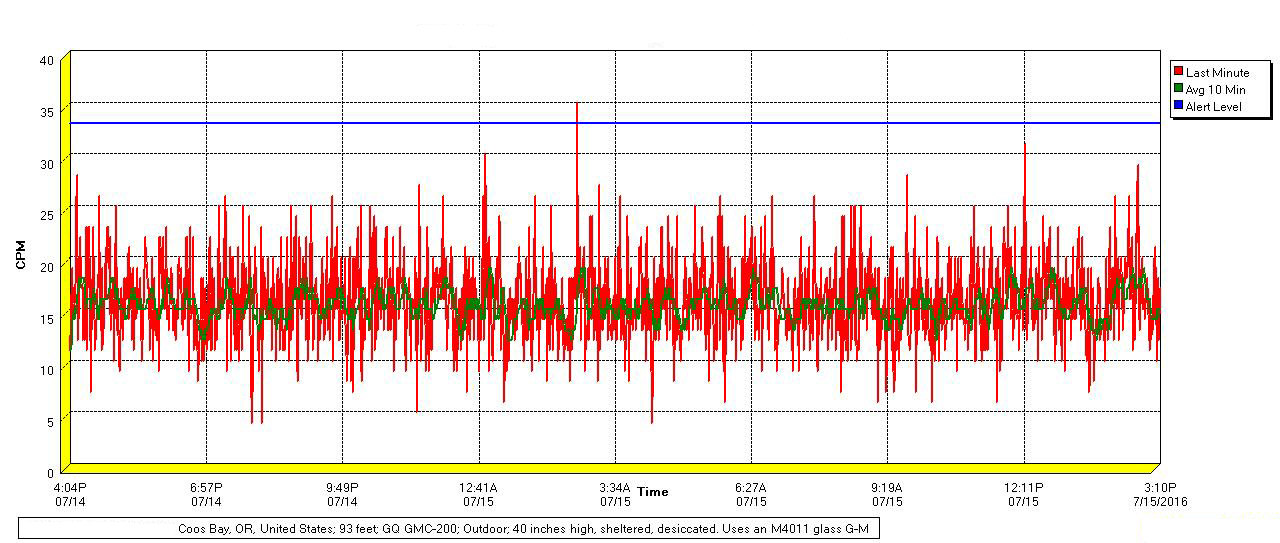
This is a typical graph, probably including that 35cpm
spike plus all the lesser ones. Catching and
counting gamma rays is similar to counting people
passing through the gate at your county fair --per
minute. Sometimes a bunch goes through, sometimes
hardly anyone, and you can expect a distribution
of counts over time (a "Poisson distribution") that's
similar to this graph. I'm going by results now (like: "how
often do I get a given peak?", rather than calculating
so many "standard deviations" from a long term average --and
by whether the graph appears to show a build up to
a bit of a high plateau --rather than throwing a one-off "isolated" peak.
~21st: Lost data, so only the late night and early
morning 10 hours, which I "corrected" by +2.1%, based on a
recent day-to-night averaging comparison.
~22nd: 33cpm peak at 05:16 hours (UTC). (Isolated)
~31st: Above times UCT/GMT. No further threshold crossing
peaks to report, as of this (PST) morning.
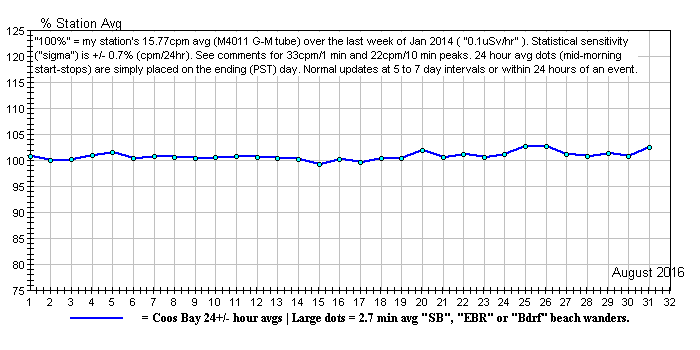
August - 2016
~ 8th: 33cpm peak at 09:50 hours (UTC). (Isolated)
~ 9th: 34cpm peak at 04:12 hours. (Isolated)
~ 9th: 33cpm peak at 19:24 hours. (Isolated)
~ 14th: Was only able to monitor and average the last
11 hours of this 24 hour period.
~ 18th: 34cpm peak at 11:59 hours. (Isolated)
~ 20th: 33cpm peak at 03:35 hours and another 33cpm
peak at about 09:00 hours. (Both isolated)
~ 24th: 34cpm peak at 19:23 hours. (Isolated.) Noted:
similarly timed peak on the 9th. High 102.7% average.
~ 25th: 33cpm peak at 23:20 hours. (Isolated.)
~ Note: single, one minute peaks are accurately timed
(UTC), while subsequent peaks or high 10 minute averages must be estimated
from their positions on GeigerGraph
plots (which have peculiar time intervals).
~ 31st: Above times UCT/GMT. No further threshold
crossing peaks to report, as of this (PST) morning.
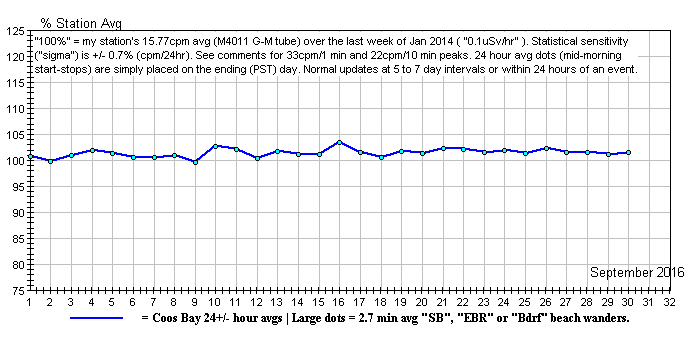
September - 2016
~ 1st: 33cpm peak at 09:50 hours (UTC). (Isolated)
~ 28th: 34cpm peak at 07:06 hours. (Isolated)
~ 30th: Above times UCT/GMT. No further
threshold crossing peaks to report, as of this (PST) morning.

October - 2016
~ 2nd: 35cpm peak at 03:58 hours (UTC). (Isolated)
~ 3rd: 33cpm peak at 12:16 hours. (Isolated)
~ 11th: 35cpm peak at 07:16 hours. (Quite isolated
--from a very quiet looking graph (saved).)
~ 12th: 33cpm peak at 13:01 hours. (Isolated, but
my 24 hour average is up. Saved graph and spreadsheet.)
~ 15th: Stormy weather, but doesn't appear to affect
the graph (nor in years past records).
~ 27th: 33cpm peak at 22:11 hours. (Isolated)
~ 31st: Above times UCT/GMT. No further threshold
crossing peaks to report, as of this (PST) morning.
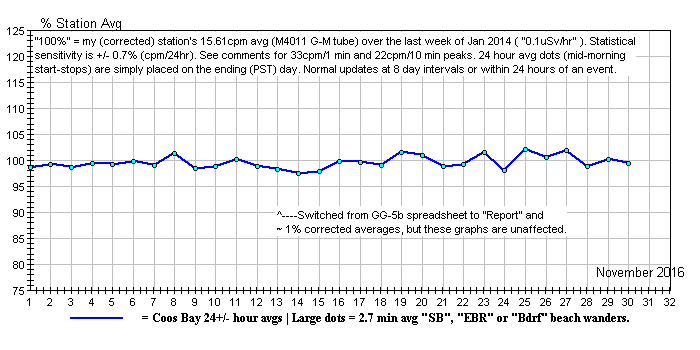
November - 2016
~ 6th: 33cpm peak at 20:06 hours (UTC). (Isolated)
~ 18th: 33cpm peak at 14:49 hours. (Isolated)
~ 21st: 33cpm peak at 10:03 hours. (Isolated)
~ 23rd: 34cpm peak at 16:23 hours. (Isolated)
~ 30th: Times are UCT/GMT. No further threshold crossing
peaks to report, as of this (PST) morning.
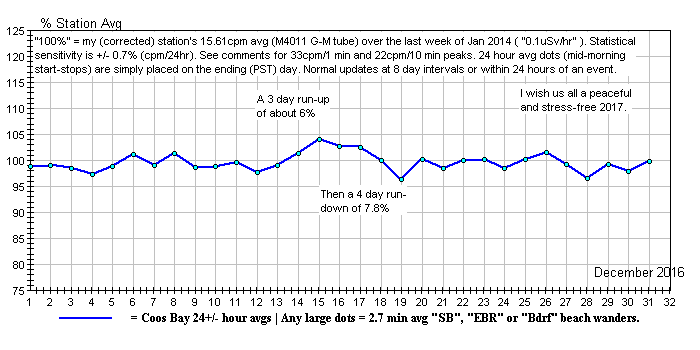
December - 2016
~ 3rd: 37cpm peak at 13:50 hours (UTC). (Isolated)
~ 9th: 37cpm peak at 16:17 hours. (Isolated)
~ 11th: 33cpm peak at 10:37 hours. (Isolated)
~ 12th: 35cpm peak at 11:52 hours. (Isolated)
~ 14th: 34cpm peak at 01:50 hours. (Isolated)
~ 15th: The past 24 hour average reached 104.1% this
morning. Otherwise, the daily graph looks normal.
~ 19th: A run-up and then down --as noted.
~ January 1st: Times are UCT/GMT. No further threshold
crossing peaks as of this morning.
~~~~~~~~~~~~~~~~
A comparison of my monitoring in Oregon, USA with
Peter Daley's in Australia:
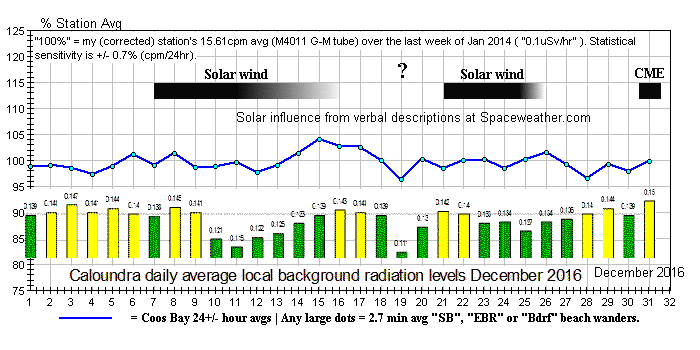 * That mid-month rough correspondence suggests that we
might be looking at a commonality of cosmic radiation,
* That mid-month rough correspondence suggests that we
might be looking at a commonality of cosmic radiation,
perhaps with influence from the recent solar winds
--plus overlays of more local phenomena and "noise".
* One gets the impression that there was some kind
of an event spanning the 17th through the 19th. / The solar notations are
from my readings/interpretations of Dr. Tony Phillips' daily descriptions
at Spaceweather.com.
* Some are of the opinion that solar winds and other
activity "sweep away" a lot of the primary cosmic rays (from deep space),
the secondaries of which (mostly muons near sea level) make up half or
more of the "background radiation" that Geiger counter type monitoring
stations tally up.
* If I get another distinctive looking graph, I'll
compare data again.
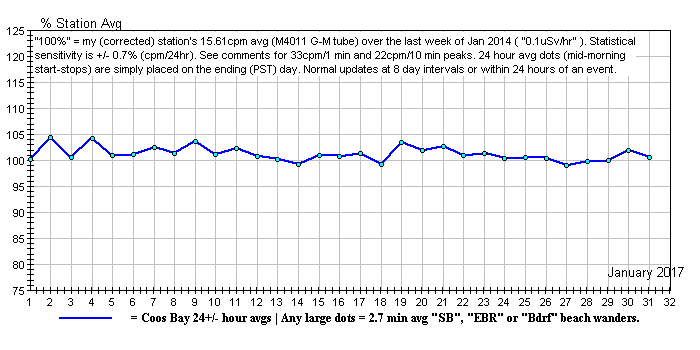
January - 2017
~ 5th: Don't know what to make of that saw
tooth. We had 4.5 inches of fluffy new snow on the 4th.
~ 31st: No threshold crossing peaks as of this morning.
There was only one sun spot this past month (that I recall)
but a lot of solar wind --for which you can check the record at: Space
Weather
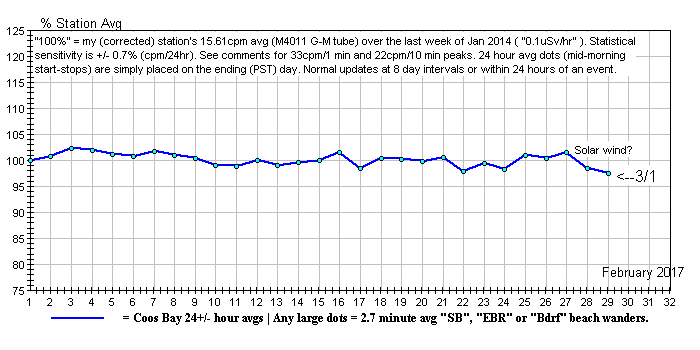
February - 2017
~ 3rd: 33cpm peak at 10:00 hours (UTC). (Isolated)
~ 5th: 33cpm peak at 18:16 hours. (Isolated)
~ 21st: 33cpm peak at 09:45 hours. (Isolated)
~ 24th: 34cpm peak at 08:08 hours. (Isolated)
~ 24th: 33cpm peak at 09:00 hours (+/-). (Isolated)
~ March 1st: No other threshold crossing peaks as
of this morning.
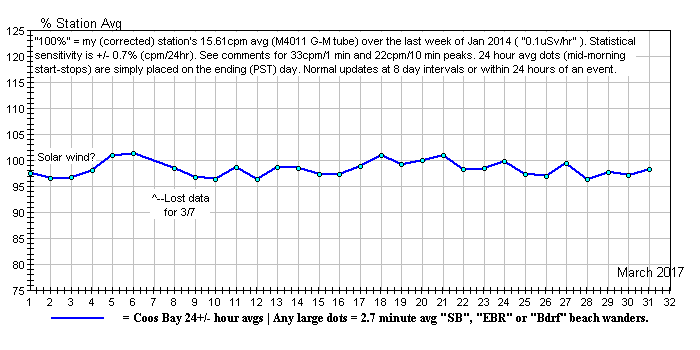
March - 2017
~ For months there's been too much recent rainfall to
do a beach walk reading (cesium being water soluble).
~ March 31st: No threshold crossing peaks as of this
morning.
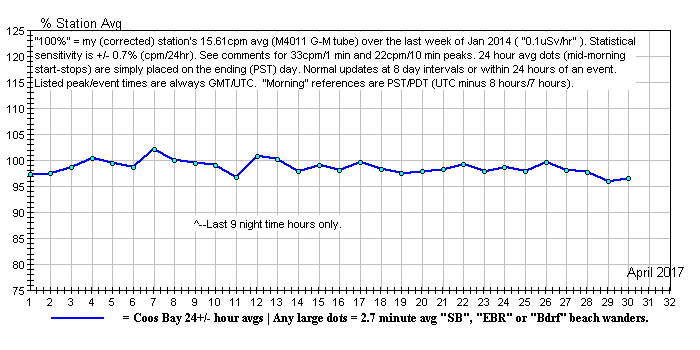
April - 2017
~ 7th: 34cpm peak at 18:59 hours (UTC). (Isolated)
~ 30th: No other threshold crossing peaks as of this
morning (PST/PDT).
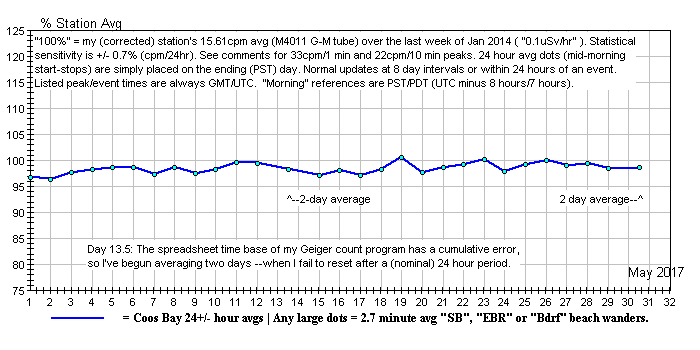
May - 2017
~ 25th: 34cpm peak at 08:26 hours (UTC). (Isolated)
~ 31st: No other threshold crossing peaks as
of this morning (PST/PDT).
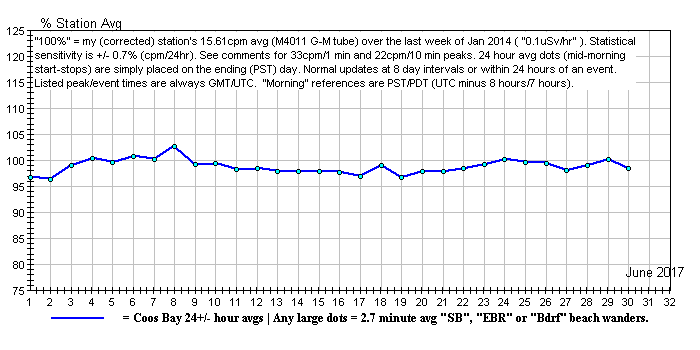
June - 2017
~ 8th: The day's graph looked normal --save that
the average is somewhat high and the above graph looked like a build-up.
(We hit 104% six plus months ago.)
~30th: No threshold (33cpm) crossing peaks as of this
morning (PST). We've had five 32cpm peaks this month, all of them isolated
--meaning no build-ups and they looked like the high end of statistical
noise. However: that there've been no 33cpm peaks is statistically significant.
High altitude counts (see Space
Weather) show a marked increase of 10 to 15%, which is attributed to
our Sun having entered a quiet period --the solar wind being less able
to sweep away incoming cosmic primary rays. Peter Daly's Australia
based station has seen just this much of an increase, but my station
cleaves doggedly near its long term average of 15.61cpm (= "100%" and approximately
an indicated "0.10 uSv" [on a Geiger counter so calibrated in otherwise
meaningless Cs-137 gamma "dose" units]).
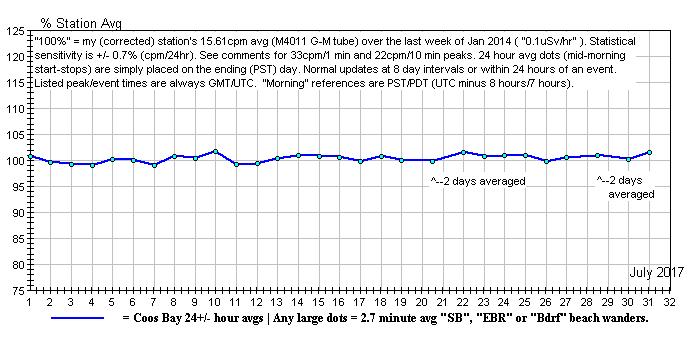
July - 2017
~ 1st: 33cpm peak at 21:34 hours (UTC,
isolated).
~ 2nd: 33cpm peak at 00:05 hours (isolated).
~ 7th: 35cpm peak at 08:27 hours
(isolated).
~ 14th: 33cpm peak at 14:39 hours (isolated).
~ 26th: 33cpm peak at 14:23 hours (isolated).
~ 29th: 34cpm peak at 13:41 hours (isolated).
~ 30th: 33cpm peak at 13:33 hours (isolated).
~ 31st: No other threshold crossing peaks as
of this morning (PST/PDT).
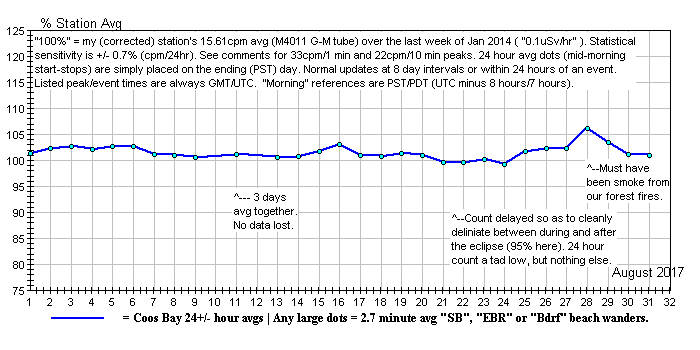
August - 2017
~ 5th: 36cpm peak at approximately 05:30
hours (UTC, isolated).
~ 6th: 34cpm peak at 18:06 hours
(isolated).
~ 10th: 34cpm peak at 01:28 hours (isolated).
~ 11th: Spaced out --doing astronomy projects.
Let my Geiger counting go for 2 mornings. I've missed no peaks.
~ 13th: 36cpm peak at 18:16 hours (isolated).
~ 15th: 32cpm --below threshold, but looks like
a build-up of peaks at about 21:18 hours.
~ 16th: 33cpm peak at about (isolated). The
24 hour average reached 103% this morning (PST/PDT).
~ 17th: 34cpm peak at 13:09 hours. No avg build-up,
but there was a brief "build-up" of peaks (saved the graph).
~ 22nd: 38cpm peak at 13:55 hours --isolated? Minute-by-minute
peaks: 17, 20, 20, 38, 20, 16. Hmmmnn.
~ 23rd: This graph and report posted a day early on
account of the recent eclipse (morning of the 21st, PST/PDT).
~ 28th: 33cpm peak at 12:05 hours with sort
of a following decay.
* The 24 hour average is "way" up, which is only 6.2% above the station's
baseline average, but that's the highest since I started 24 hour averaging
in January of 2014.
* It's probably due to all the smoke in the air from the fierce forest
fires burning in Oregon. The smoke particles could be collecting radon.
The fires could also be releasing long-lived radionuclides (Cs-137?) which
were captured as the trees grew.
* Another possibility: during the eclipse (morning of the 21st) I noticed
significant sunspots. Today the Sun looks clear (at 8 power), and the day's
Space
Weather indicates that the solar wind is low, but is due to return
about August 31st. (The solar wind helps repel primary cosmic rays. Check
with Space Weather for more details.)
~ 31st: No other threshold crossing peaks as
of this morning (PST/PDT). The 1, 10, 60 minute graphs and the above 24
hour graph are normal.
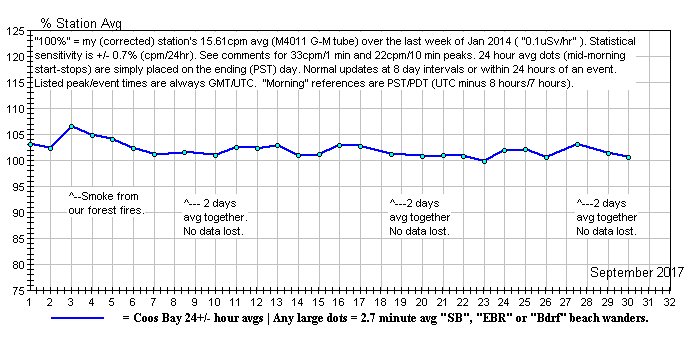
September - 2017
~ 5th: 34cpm peak at approximately 16:43
hours (UTC, isolated).
~ 7th: Recent X-9 solar flare. A
CME might hit us on the 8th.
~ 9th: Two days averaged together
--no data lost, no more threshold crossing peaks as of this morning (PST/PDT).
~ 10th: I saw no indication of either the September
7th CME (arrived on the 10th, producing a "Forbush
minimum" at south pole) or the September 10th X class flare. See Space
Weather for more.
~ 11th: 33cpm peak at 14:31 hours (isolated).
~ 20th: 37cpm peak at 19:32 hours. Isolated,
but several curious, somewhat periodic, lesser peaks across graph.
~ 23rd: 39cpm peak at 13:19 hours. Very isolated
(12, 20, 39, 17, 21, 10).
~ 30th: 36cpm peak at 12:29 hours (UTC, isolated).
~ 30th: No other threshold crossing peaks as
of this morning (PST/PDT).
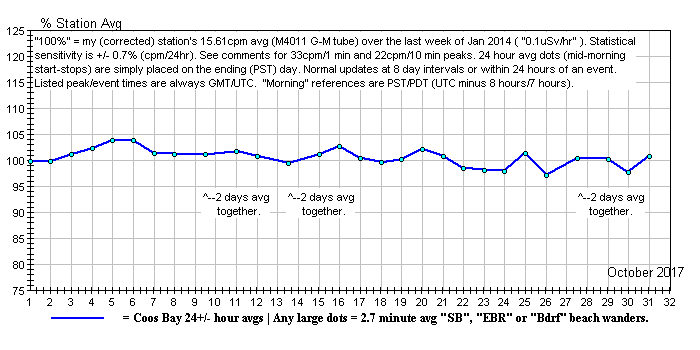
October - 2017
~ 4th: 33cpm peak at 10:40 hours (UTC,
isolated).
~ 4th: 33cpm peak at 23:17 hours
(isolated).
~ 8th: 34cpm peak at 03:18 hours
(isolated).
~ 10th: 35cpm peak at 08:30 hours (isolated).
~ 16th: 36cpm peak at 10:14 hours. Isolated
(no build up/down). Followed by 2 descending peaks (saved screen).
~ 25th: 33cpm peak at 12:57 hours (isolated).
~ 28th: 36cpm peak at 21:05 hours (isolated).
~ 31st: No other threshold crossing peaks as
of this morning (PST/PDT).
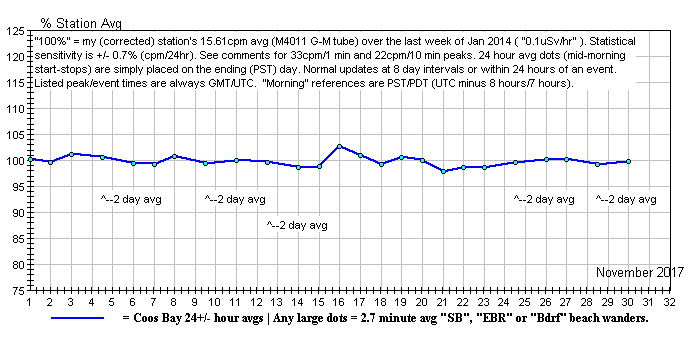
November - 2017
~ 7th: 35cpm peak at 09:10 hours (isolated).
~ 13th: 38cpm peak at 01:04 hours (isolated).
~ 13th: 33cpm peak at about 16:00 hours (isolated).
~ 18th: 33cpm peak at 18:06 hours (isolated).
~ 29th: 33cpm peak at 04:12 hours (isolated).
~ 30th: No other threshold crossing peaks as
of this morning (PST).
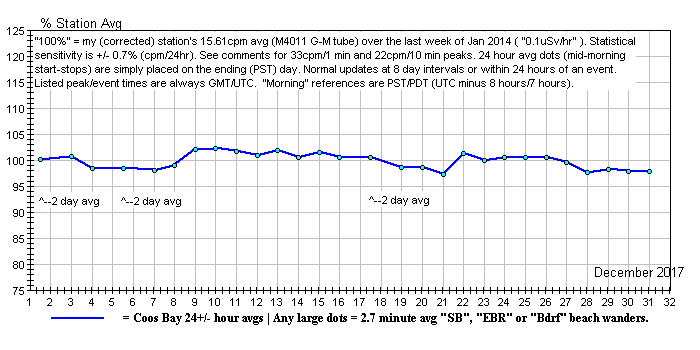
December - 2017
~ 13th: 33cpm peak at 17:38 hours (isolated).
~ 14th: 35cpm peak at 04:57 hours (isolated).
~ 15th: 33cpm peak at 11:22 hours (isolated).
~ 16th: 35cpm peak at 11:16 hours (isolated).
~ 25th: 35cpm peak at 08:39 hours (isolated).
~ 31st: No other threshold crossing peaks
as of this morning (PST).
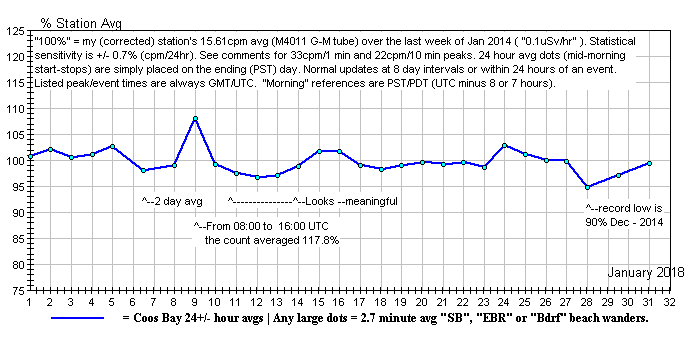
January - 2018
~ 1st: 37cpm peak at 15:16
hours (always UCT) (isolated).
~ 2nd: 33cpm peak at 21:04 hours
(isolated).
~ 8th: No other threshold
crossing peaks as of this morning (PST).
~ 8th: 34cpm peak at 21:03
hours (isolated).
~ 9th: No threshold crossing
peaks today, but between 08:00 and 16:00 hours (UTC) the average hit 117.8%!
I'm not aware of any special reason for it. Here's a 2 day graph (Ctrl+
to enlarge the images.):
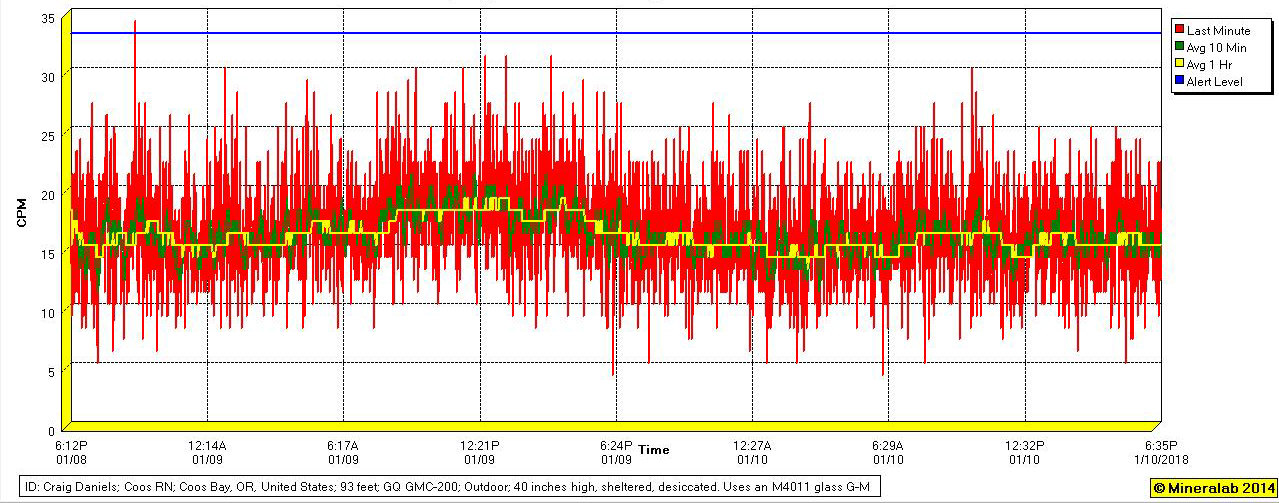 --for which 15.61cpm equals "100%" (my station's 2-week baseline average
4 years ago). My steep roof sheltered, sealed, one meter above the ground,
outdoor sensor only responds to gamma type and very hard beta radiation.
For all I know, this elevated count period could be cosmic ("muons") in
origin, or the 8 hour sleep period (midnight to 8am here) of a neighbor
with a radioactive tracer in her blood.
--for which 15.61cpm equals "100%" (my station's 2-week baseline average
4 years ago). My steep roof sheltered, sealed, one meter above the ground,
outdoor sensor only responds to gamma type and very hard beta radiation.
For all I know, this elevated count period could be cosmic ("muons") in
origin, or the 8 hour sleep period (midnight to 8am here) of a neighbor
with a radioactive tracer in her blood.
~ 14th: 36cpm peak at 06:13 hours (isolated).
~ 25th: 33cpm peak at 11:12 hours (isolated).
~ 31st: No other threshold crossing peaks
as of this morning (PST).
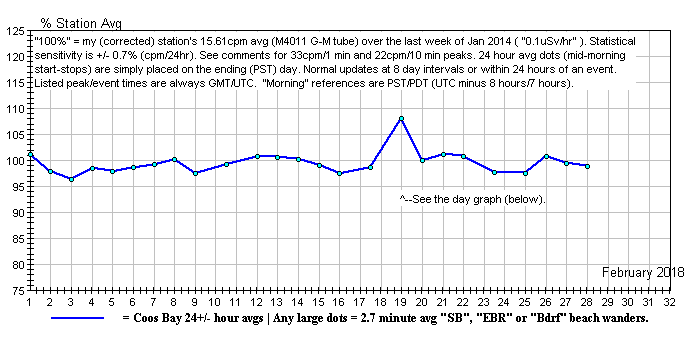
February - 2018
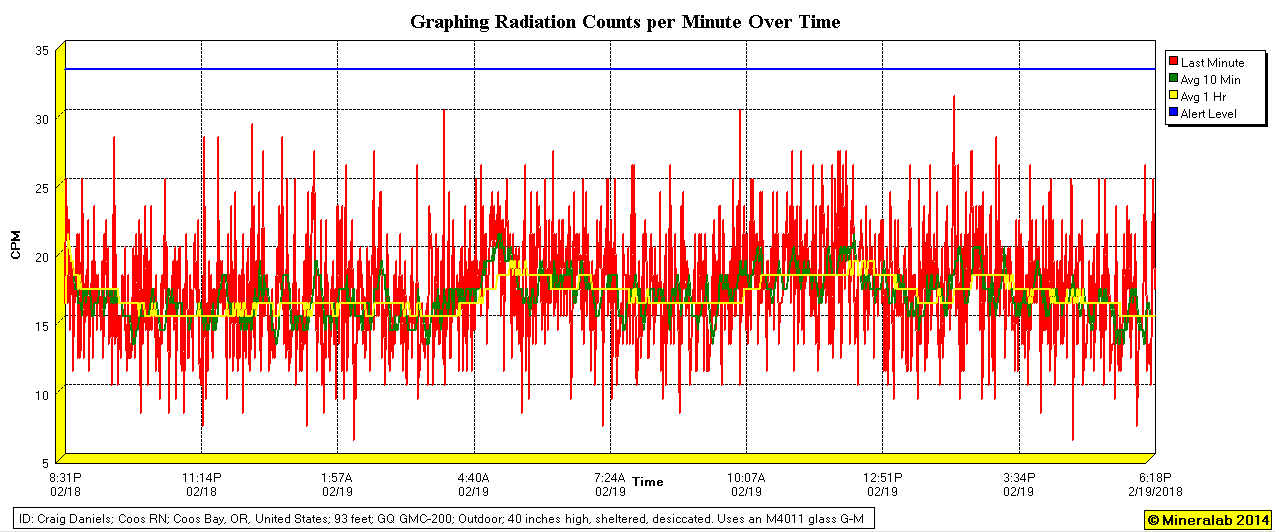
Unusually high 10 & 60 minute averages for February 18th-19th
(Ctrl+ to enlarge the images.)
~ 22nd: 35cpm peak at 17:35 hours (isolated).
~ 28th: No other threshold (33cpm) crossing
peaks as of this morning (PST).
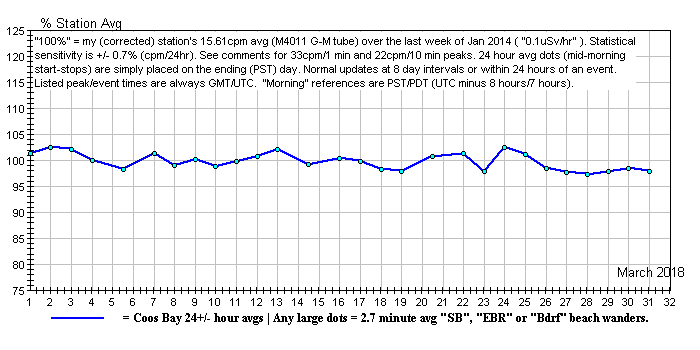
March - 2018
~ 12th: 34cpm peak at 17:13 hours (isolated).
~ 13th: 35cpm peak at 07:05 hours (isolated).
~ 17th: 33cpm peak at 10:25 hours (isolated).
~ 21st: 35cpm peak at 15:23 hours (isolated).
~ 23rd: 35cpm peak at 16:01 hours (isolated).
~ 24th: Normal looking graph today.
~ 31st: No other threshold (33cpm) crossing peaks
as of this morning (PST/PDT).
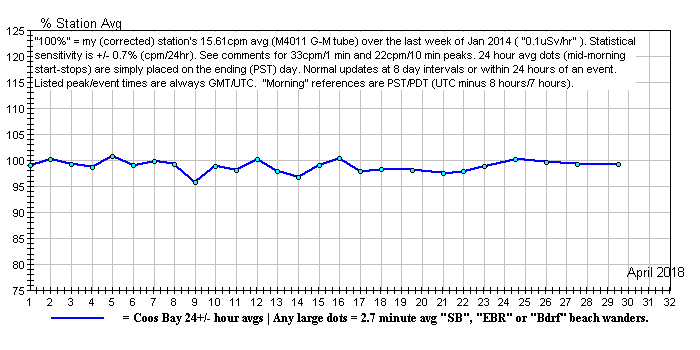
April - 2018
~ 4th: 34cpm peak at 22:45 hours UTC (isoated).
~ 15th: 35cpm peak at 05:17 hours (isolated).
~ 17th: 37cpm peak at 18:34 hours (isolated)
~ 24th: 34cpm peak at 08:13 hours (isolated)
~ 30th: No other threshold (33cpm) crossing peaks
as of this morning (PST/PDT).
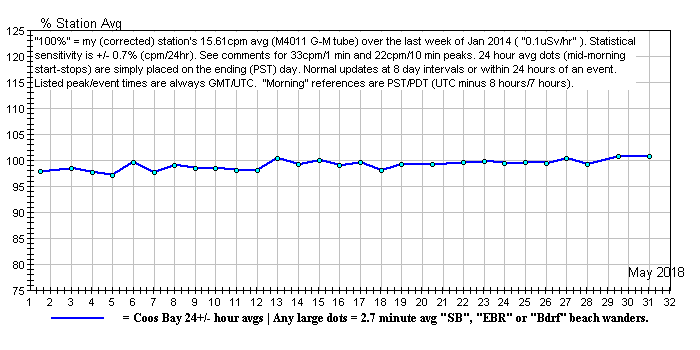
May - 2018
~ 4th: 33cpm peak at 23:48 hours UTC (isolated).
~ 14th: 34cpm peak at 13:34 hours UTC (isolated).
~ 21st: 34cpm peak at 07:48 hours UTC (isolated).
~ 24th: 33cpm peak at 12:16 hours UTC (isolated).
~ 31st: No other threshold (33cpm) crossing peaks
as of this morning (PST/PDT).
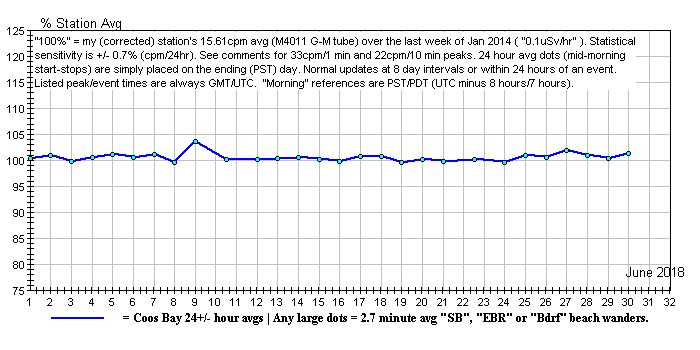
June - 2018
~ 6th: 33cpm peak at 10:52 hours UTC (isolated).
~ 7th: 35cpm peak at 10:51 hours UTC (isolated).
~ 9th: Posted this 24 hour average up-tick,
following a long calm period.
(Saved the normal looking 24 hour graph. Highest peak was 31cpm.)
~ 30th: No other threshold (33cpm) crossing peaks
as of this morning (PST/PDT).
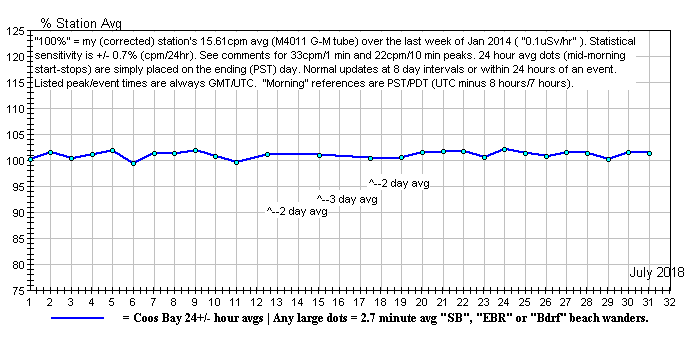
July - 2018
~ 7th: 33cpm peak at 02:11 hours UTC (isolated)
~ 7th: 33cpm peak at 18:09 hours UTC (isolated)
~ 12th: through 18th: Monitoring has been continuous
and no peaks have been missed, but I averaged over
periods of 2 days and then 3 days --due to distractions and my increasing
forgetfulness.
~ 21st: 35cpm peak at 21:28 hours UTC (isolated)
~ 31st: 33cpm peak at 10:21 hours UTC (isolated)
~ 31st: No other threshold (33cpm) crossing peaks
as of this morning (PST/PDT).
August - 2018
~ 2nd: 33cpm peak at 04:01 hours UTC (isolated)
~ 2nd: 33cpm peak at 23:56 hours UTC (isolated)
~ 9th through to the
12th: * This gap was due to my having been injected with the radioactive
tracer technetium-99m, for the procedure: "myocardial perfusion imaging",
which (by calculating backwards from my later radiation counts) initially
rendered me something like 15 times higher than background --11 feet distant.
(Six hours later, with me seated 11 feet from my outside monitoring station,
it was tallying 7.4x background. Due to the isotope being distributed throughout
my body, the "inverse square law" doesn't apply at close range, but at
roughly 3 hours, the count hit 1800cpm [115x background] when I was standing
near the sensor's housing.)
* That said, there are "tens of millions" such procedures
performed each year (see Wikipedia's Tc-99m articles) with an over-all
casualty rate of 1 cancer or leukemia per 1000 patients. Technetium-99m
emits (some sources say "only") gamma at 0.142 MeV (142 KeV), plus (other
sources say) loses 12% of its mass via beta decay at a similar low energy.
The injected 99m pretty much decays into plain technetium-99 in a day or
two, which in turn decays by way of low energy beta (electron) emission
--but that takes 211,000 years, so its dose rate^
is pretty low --plus: the biological half-life for both 99m and 99 is only
24 hours.
* And that said: The radiation I've sustained
from my particular procedure is (per the Wiki) the equivalent of 94 (2
view) chest X-rays (!!) --and my wife gets a second-hand exposure at 1/10th
of a chest X-ray, so I now have a (linear exposure theory extrapolated)
statistical 1 in 5000 lifetime risk of developing a solid cancer or leukemia
--but it's actually much less, since I'm already 75 years old and (statistically)
almost dead anyway --but maybe it's more --after a lifetime's accumulation
of such risk factors (radioactive and otherwise).
* I have to wonder about all the technetium-99 which
passes through the bodies of "tens of millions" of patients and out into
the environment.
^ Since the indicated dose rates
of Geiger counters are typically calibrated with a standard cesium-137
source (the intermediary decay product of Barium-137m is what actually
radiates), perhaps the 142 keV gamma rays of technetium-99m are a lot less
ionizing and less biologically impactful than are the 662 keV gamma rays/photons
of Cs-137. I believe we report dose units of micro-REMs (uR) and Sieverts
(uSv) to each other for convenience, since they're cross-Geiger-counter
comparable --even though most folks take the indicated "dose" seriously.
~ 13th: 33cpm peak at 01:30 hours UTC (isolated).
~ 16th: 34cpm peak at 00:17 hours UTC (isolated).
~ 20th: 33cpm peak at 15:11 hours UTC (isolated).
~ 20th: 33cpm peak at 21:19 hours UTC (isolated).
~ 25th: 33cpm peak at 19:22 hours UTC (isolated).
~ 27th: A G3 solar sourced magnetic storm today, but
to no apparent affect.
~ 30th: 33cpm peak at 01:15 hours UTC (isolated).
~ 31st: No other threshold (33cpm) crossing peaks
as of this morning (PST/PDT).
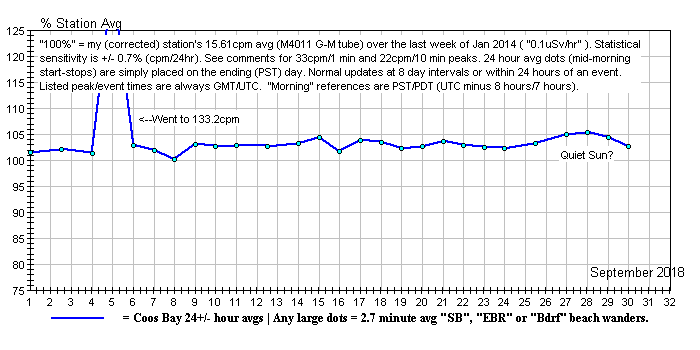
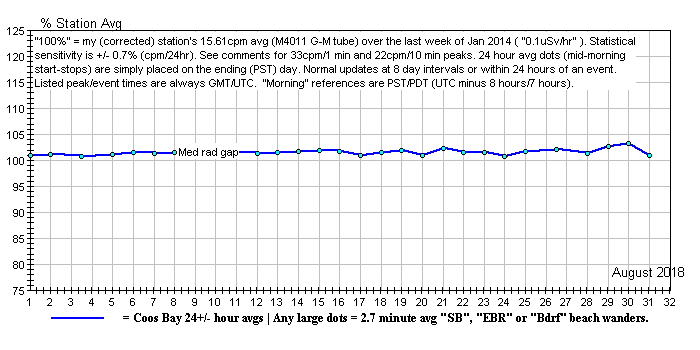
September - 2018
~ 5th: My outside station count did a whoop-dee-doo
at 20:38 hours UTC, hitting a 50cpm peak at about 22:40 hours. Judging
by the sudden rise and the rate of decay, this is about a Technetium-99m
dosed neighbor coming home from his/her appointment. I saw nothing special
to the north or south on the Radiation
Network map.
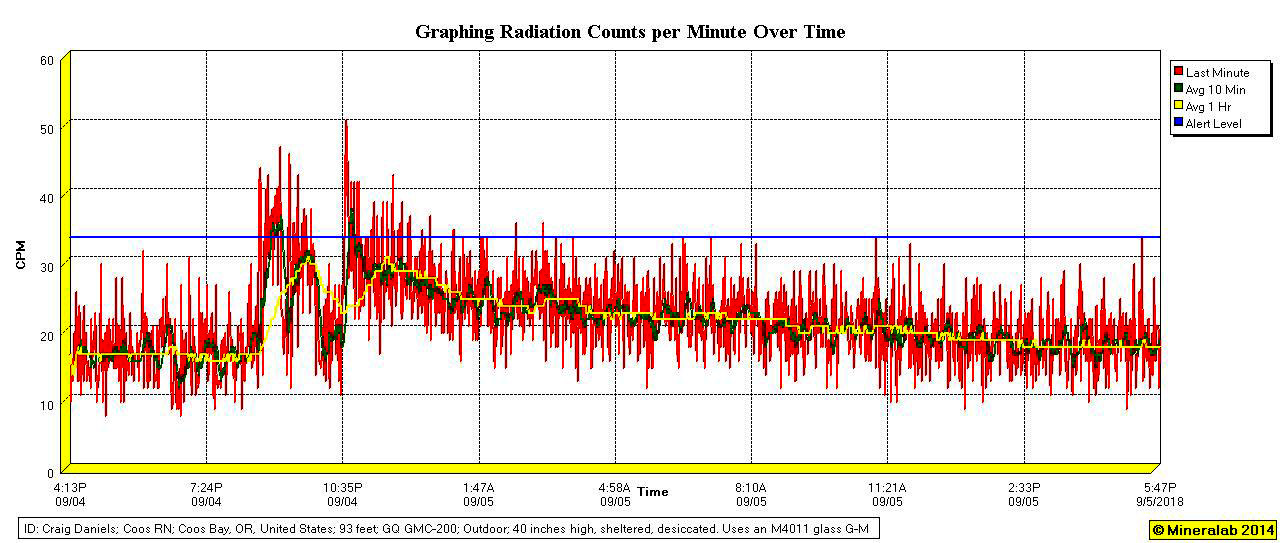
Sorry for the 12 hour UTC format --and for those time
base intervals. (Ctrl+ to enlarge the images.)
~ 8th: 33cpm peak at 06:08 hours UTC (isolated).
~ 13th: 33cpm peak at 21:21 hours UTC (isolated).
~ 16th: 36cpm peak at 22:23 hours UTC (isolated).
~ 18th: 33cpm peak at 06:43 hours UTC (isolated).
~ 25th: 34cpm peak at 02:43 hours UTC (isolated).
~ 29th: 33cpm peak at 20:29 hours UTC (isolated).
~ 30th: No other threshold (33cpm) crossing peaks
as of this morning (PST/PDT).
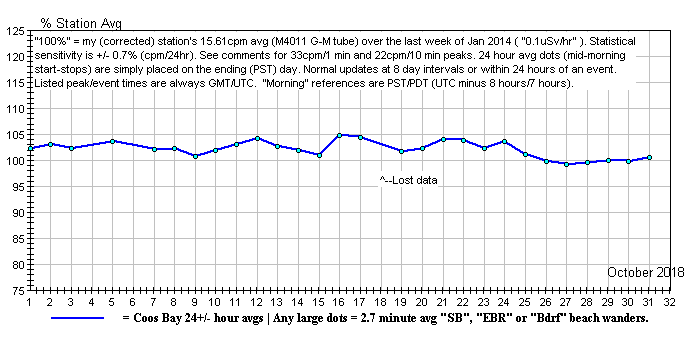
October - 2018
~ 5th: This is the middle of 3 days averaged.
(Events and obligations come up and I forget.) (75 years old.)
~ 6th: 37cpm peak at 11:01 hours UTC (Quite
isolated --to a single minute).
~ 9th: 33cpm peak at 18:11 hours UTC (isoated).
~ 12th: 37cpm peak at 14:58 hours UTC (isolated --1
minute only).
~ 12th: 33cpm peak at 19:30 hours UTC (isolated).
~ 13th: 34cpm peak at 12:04 hours UTC (isolated).
~ 18th: Found my counter program shut down --must
have forgotten to restart it.
~ 19th: 33cpm peak at 16:45 hours UTC (isolated).
~ 23rd: 33cpm peak at 02:43 hours UTC (isolated).
~ 27th: Early graph post, due to the lack of an expected
"background" count increase.
~ 31st: No other threshold (33cpm) crossing peaks
as of this morning (PST/PDT).
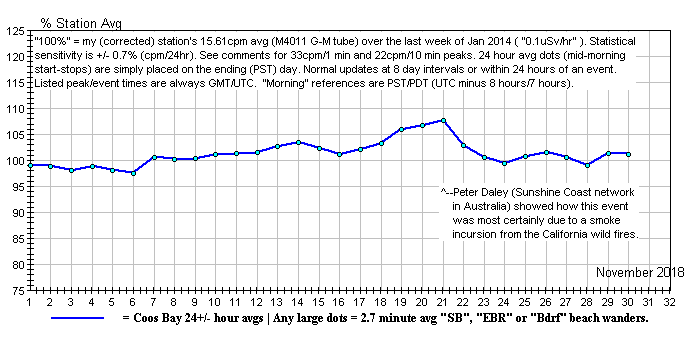
November - 2018
~ 1st: 33cpm peak at 15:13 hours UTC (isolated).
~ 4th: 35cpm peak at 10:46 hours UTC (isolated).
~ 13th: 34cpm peak at about 21:00 hours UTC (isolated).
~ 14th: 38cpm peak at 05:01 hours UTC (isolated).
~ 16th through 24th: Highest 24 hour averages since
January-February and highest build-up/decay type
24 hour averages in years. Peter Daley (who operates the
Sunshine Coast station)
showed our e-group weather maps which indicate this event is surely due
to a smoke
incursion from California's wild fires (well south of my station's Oregon
location).
I'm re-calibrating my inside station to corroborate
my outside station's excursions.
~ 29th: 34cpm peak at 15:17 hours UTC (isolated).
~ 30th: No other threshold (33cpm) crossing peaks
as of this morning (PST/PDT).
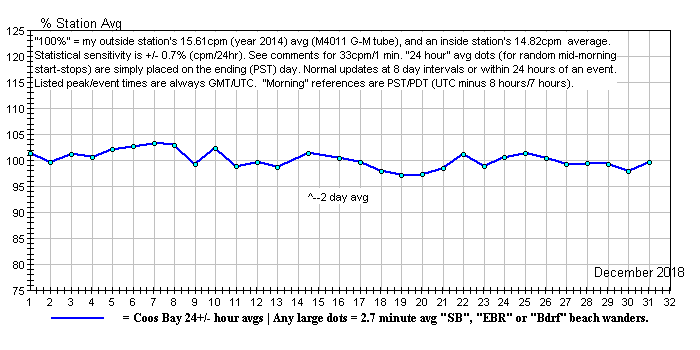
December - 2018
~ 8th: 33cpm peak at 04:08 hours UTC (isolated).
~ 15th: 34cpm peak at 11:25 hours UTC (isolated).
~ 18th: 34cpm peak at 17:21 hours UTC (isolated).
~ 21st: 33cpm peak at 20:49 hours UTC (isolated).
~ 27th: 33cpm peak at 01:40 hours UTC (isolated).
~ 31st: No other threshold (33cpm) crossing peaks
as of this morning (PST/PDT).
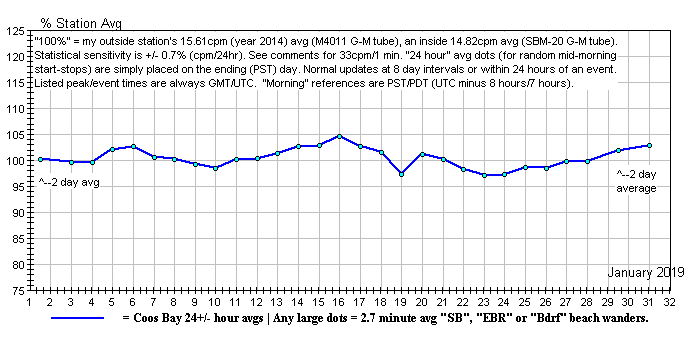
January - 2019
~ 14th: 33cpm peak at 06:11 hours UTC (isolated).
~ 14th: 34cpm peak at 19:34 hours UTC (isolated).
~ 24th: 33cpm peak at 00:34 hours UTC (isolated).
~ 31st: No other threshold (33cpm) crossing peaks
as of this morning (PST/PDT).
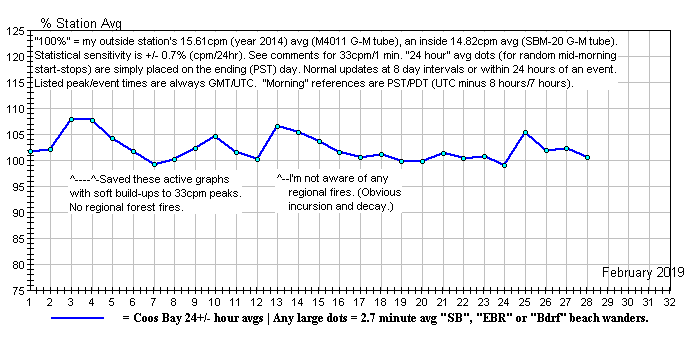
February - 2019
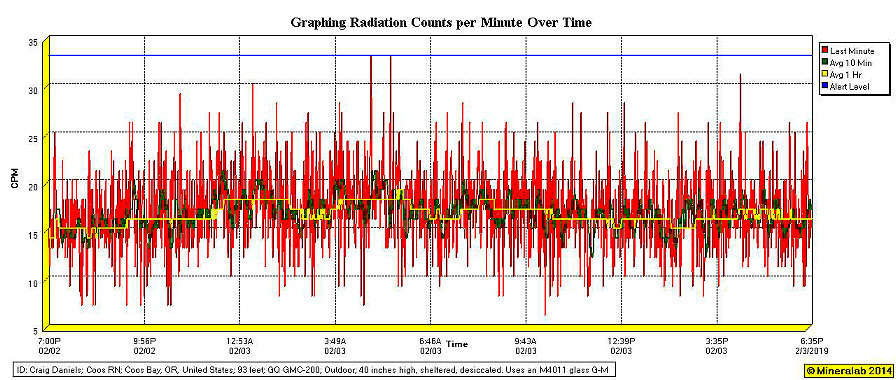
The day graph from 2/2/2019 to 2/3/2019 (Ctrl+
to enlarge the images.)
(Sorry for the 12 hour UTC format --and those inscrutable
time base intervals.)
~ 3rd: 33cpm peak at about 04:00 hours UTC
(isolated with soft build-up).
~ 3rd: 33cpm peak at 04:58 hours UTC (isolated
with soft build-up).
~ 4th: 33cpm peak at 07:47 hours UTC (isolated
with soft build-up).
~ 22nd: 34cpm peak at 03:26 hours UTC (isolated).
~ 28th: No other threshold (33cpm) crossing peaks
as of this morning (PST/PDT).
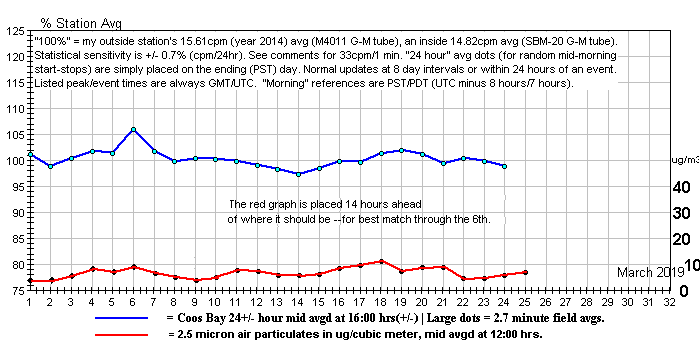
March - 2019
~ 31st: There's a monitoring station for smoke from regional
forest fires and slash burns that's only 1.6 miles from our outside radiation
monitoring station. It's on the Web and reports 2.5 micron size particulates
--as estimated micrograms per cubic meter of air. Maintained by a consortium
of volunteers, it posts hourly as well as daily averages. I've graphed
it until the 25th. There doesn't appear to be much correlation at these
low levels. No doubt we'll see some future mutual peaks --and I'll try
to access earlier smoke data as well. The smoke station is at about 285
feet (above MSL). My station's at 93 feet.
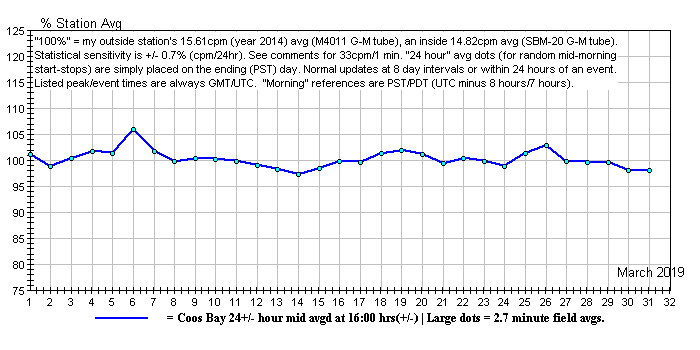
March - 2019 (continued)
~ 3rd: 33cpm peak at 23:30 hours UTC (isolated,
with a 31cpm leading spike).
~ 6th: 33cpm peak at 16:09 hours UTC (isolated,
but a busy graph today).
~ 22nd: 33cpm peak at 07:37 hours UTC (isolated, but
a busy^ graph today).
~ 31st: No other threshold (33cpm) crossing peaks
as of this morning (PST/PDT).
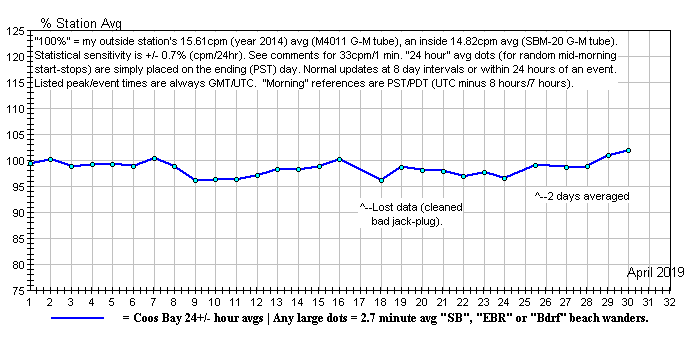
April - 2019
~ 17th: Cleaned bad connections --after losing the daily
total count.
~ 20th: 33cpm peak at 03:01 hours (UTC) (isolated).
~ 25-26th: Forgot and let the count run for 2 days.
Nothing lost (except daily resolution).
~ 30th: No other threshold (33cpm) crossing peaks
as of this morning (PST/PDT).
May - 2019
~ 3rd: 33cpm peak at (about) 09:00 hours (all
UTC) (isolated).
~ 3rd: 35cpm peak at 13:51 hours (isolated).
~ 4th: 33cpm peak at 10:05 hours (isolated).
~ 4th: 35cpm peak at 11:01 hours (isolated).
~ 6th: 33cpm peak at 11:31 hours (isolated).
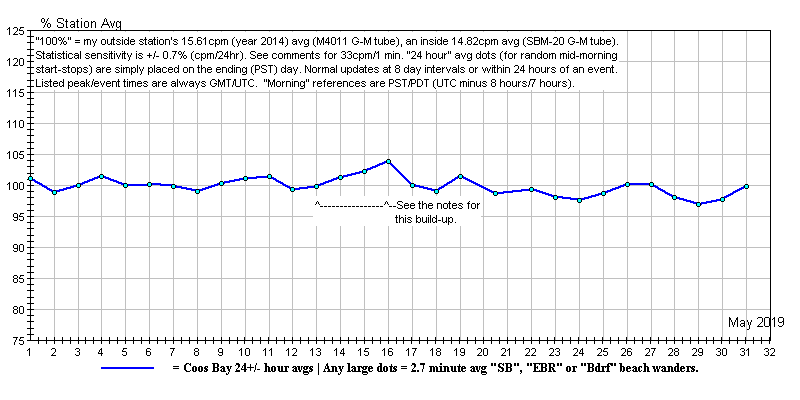
~ 11th: 34cpm peak at 17:25 hours (isolated).
~ 14th: 36cpm peak at 11:56 hours (isolated).
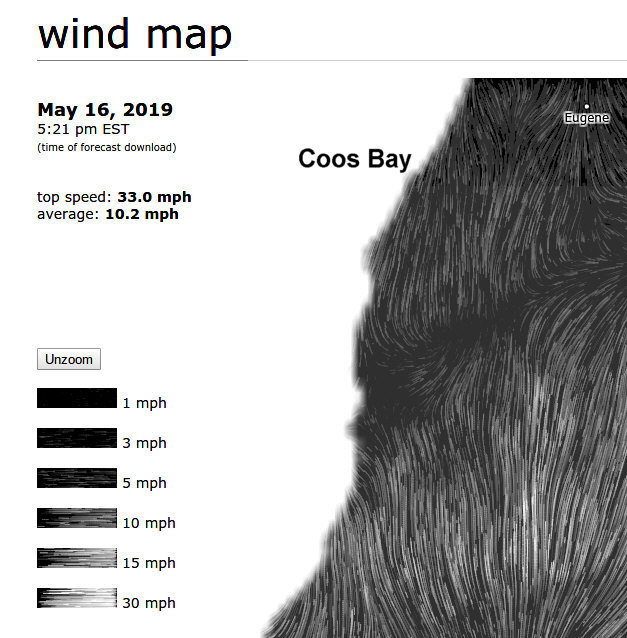
~ 13th through 16th: Looks like a mild build-up. It
started raining again, NASA Space Weather speaks of incoming coronal mass
ejections from the Sun, the wind is from the north, a smoke/particulate
station just 1.6 miles distant looks normal and about half of what it was
back in March. (I was waiting for such an increase
in order to compare the smoke graph and to standardize how to present it
here.)
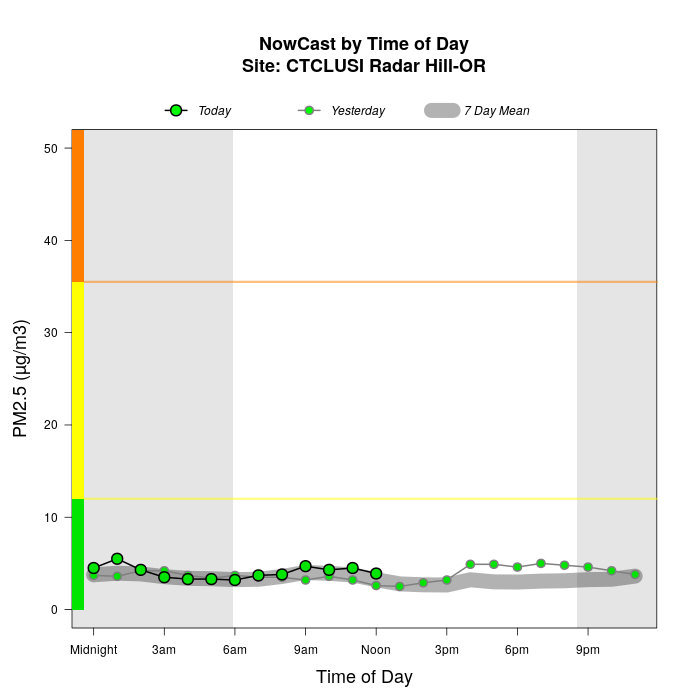
Both displays are as of the 16th of May.
~ 16th: 33cpm peak at 11:30 hours UTC (isolated). (Saved
display screen due to mild build-up.)
~ 24th: 36cpm peak at 13:21 hours (isolated).
~ 26th: 33cpm peak at 05:31 hours (isolated).
~ 30th: 33cpm peak at 16:54 hours (isolated).
~ 31st: No other threshold (33cpm) crossing peaks
as of this morning (PST/PDT).
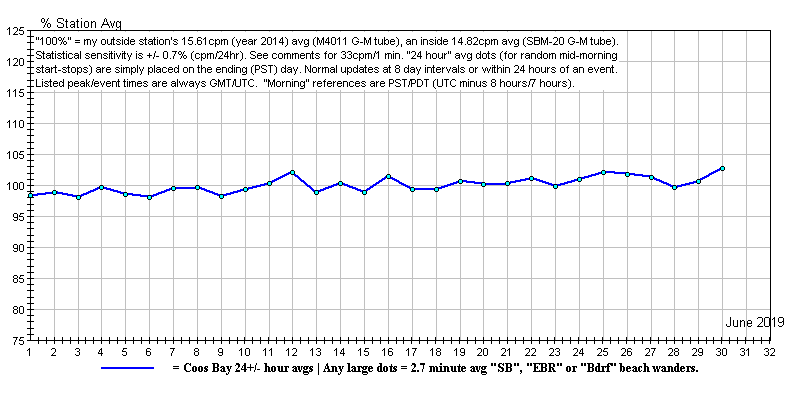
June - 2019
~ 6th: 35cpm peak at 15:08 hours UTC (isolated).
~ 7th: 33cpm peak at 10:57 hours (isolated).
~ 11th: 33cpm peak at 21:11 hours (isolated).
~ 24th: The Sun has been very quiet --no spots.
~ 30th: No other threshold (33cpm) crossing peaks
as of this morning (PST/PDT).
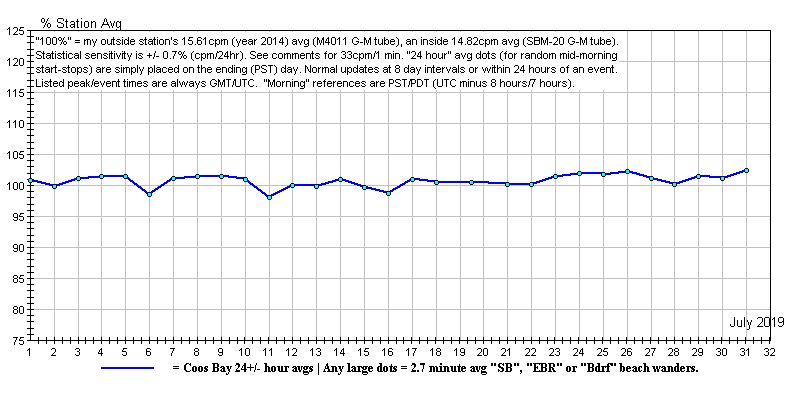
July - 2019
~ 7th: 34cpm peak at 05:22 hours UTC (isolated).
~ 8th: 35cpm peak at 01:59 hours (isolated).
~ 20th: 33cpm peak at 12:20 hours (isolated).
~ 31st: No other threshold (33cpm) crossing peaks
as of this morning (PST/PDT).
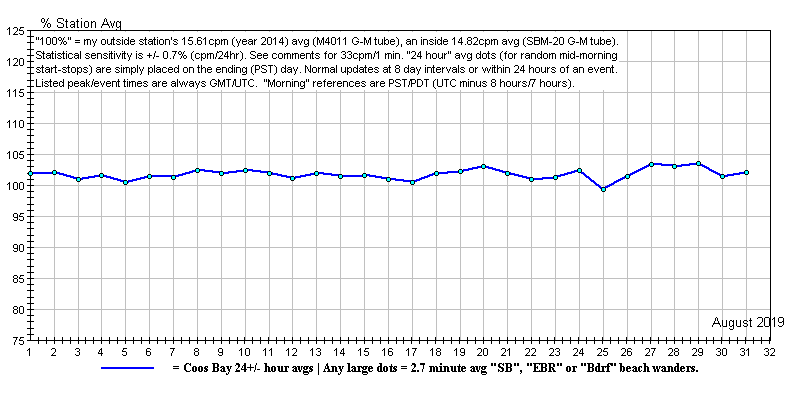
August - 2019
~ 3rd: 33cpm peak at 04:03 hours UTC (isolated).
~ 12th: 34cpm peak at 03:42 hours (isolated).
~ 19th: 33cpm peak at 07:08 hours (isolated).
~ 27th: 35cpm peak at 14:17 hours (isolated).
~ 31st: 33cpm peak at 12:24 hours (isolated).
~ 31st: No other threshold (33cpm) crossing peaks
as of this morning (PST/PDT).
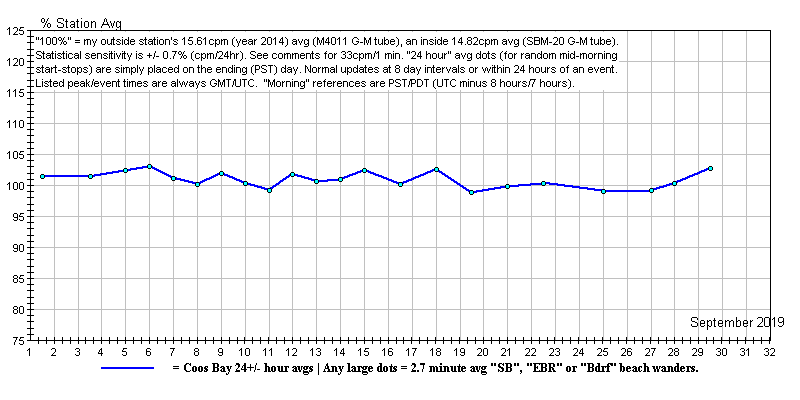
September - 2019
~ Due to distractions, I several times let the
counter run on for 2 or 3 days. No data or peaks were lost.
~ 15th: 33cpm peak at 18:44 hours UTC (isolated).
~ 16th: 37cpm peak at 07:03 hours (isolated).
~ 18th: 34cpm peak at 10:13 hours (isolated).
~ 21st: 33cpm peak at 21:27 hours (isolated).
~ 30th: No other threshold (33cpm) crossing peaks
as of this morning (PST/PDT).
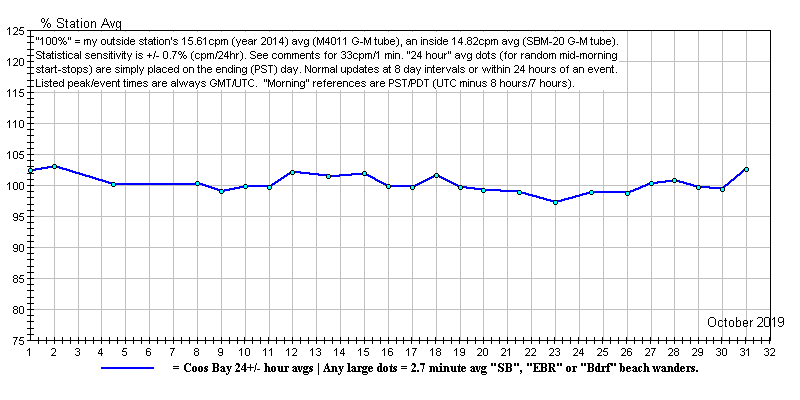
October - 2019
~ There are runs of more than one day, but no data
or peaks were lost. Fortunately, the counts have been calm.
~ 8th: 35cpm peak at 06:55 hours UTC (isolated).
~ 9th: 33cpm peak at 06:27 hours (isolated).
~ 11th: 33cpm peak at 17:19 hours (isolated).
~ 23rd: 34cpm peak at 00:01 hours (isolated).
~ 11/01: No other threshold (33cpm) crossing peaks
as of this morning (PST/PDT).
November - 2019
~ 7th: 34cpm peak at 01:38 hours UTC (isolated).
~ 9th: 34cpm peak at 17:23 hours (isolated).
~ 13th: Power failure + backup battery failure
= no data today.
~ 18th: 34cpm peak at 00:37 hours (isolated).
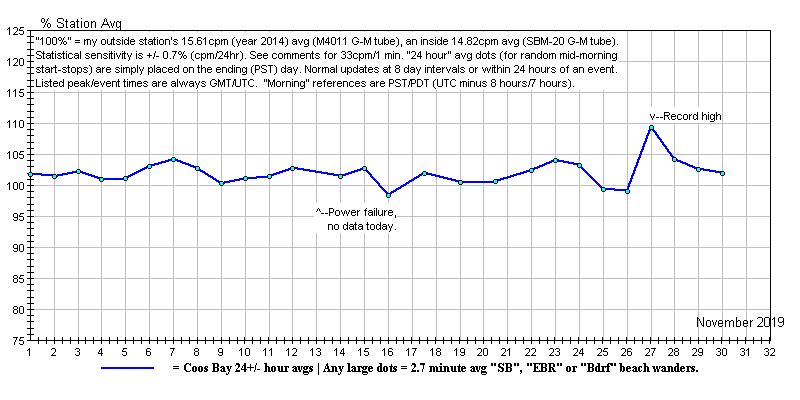
~ 27th: I'm guessing this is about the California
wild fires. I tried to access a nearby smoke
monitoring station but data for these past two days has been lost.
(They seem to lose a lot of data.) There were no threshold passing peaks.
Here's the daily Geigergraph record:
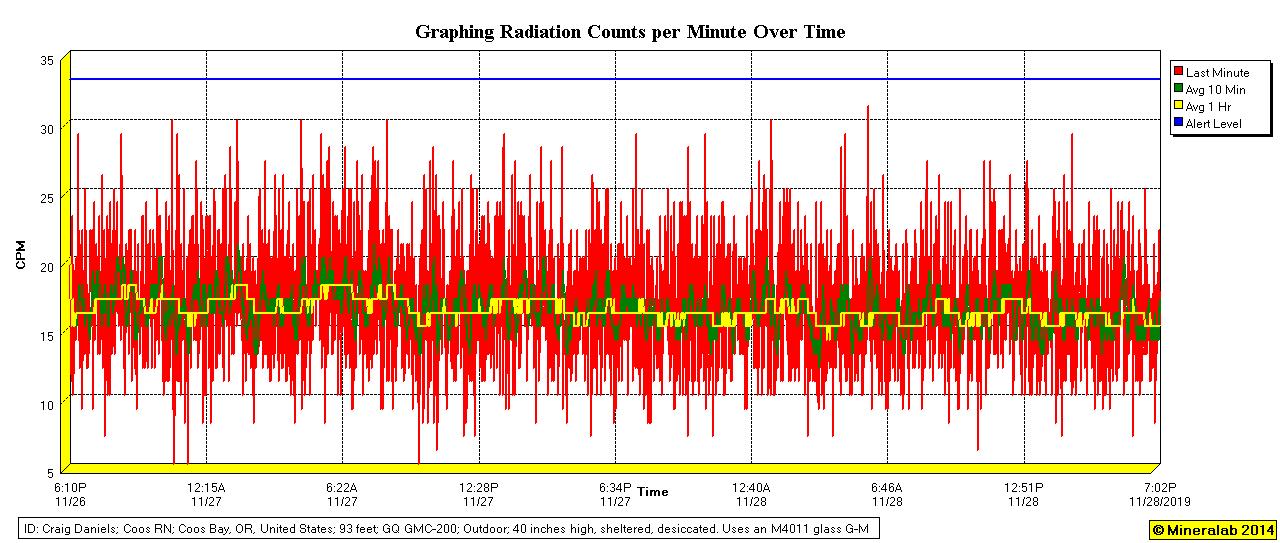
Minute by minute Geigergraph for 11/27-28 (click to
enlarge)
~ 29th: 33cpm peak at 05:15 hours (isolated).
~ 30th: No other threshold (33cpm) crossing peaks
as of this morning (PST/PDT).
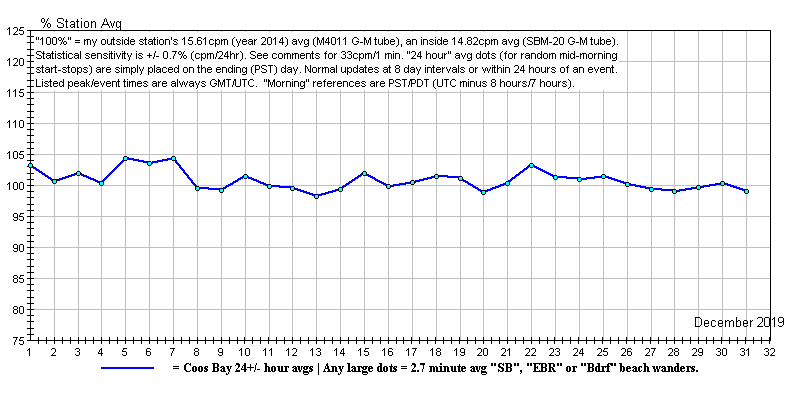
December - 2019
~ 10th: Unusually high 39cpm peak at 00:37 hours UTC
(quite isolated).
~ 13th: 34cpm peak at 16:11 hours (isolated).
~ 26th: 33cpm peak at 20:54 hours (isolated).
~ 29th: 33cpm peak at 22:43 hours (isolated).
~ 31st: No other threshold (33cpm) crossing peaks
as of this morning (PST/PDT).
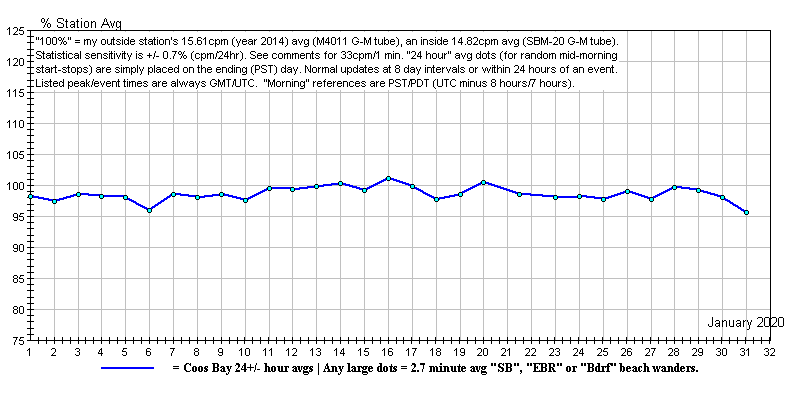
January - 2020
~ 2nd: 33cpm peak at 02:26 hours UTC (isolated).
~ 21st: 34cpm peak at 06:37 hours (isolated).
~ 23rd: 33cpm peak at 17:55 hours (isolated).
~ 31st: No other threshold (33cpm) crossing peaks
as of this morning (PST/PDT).
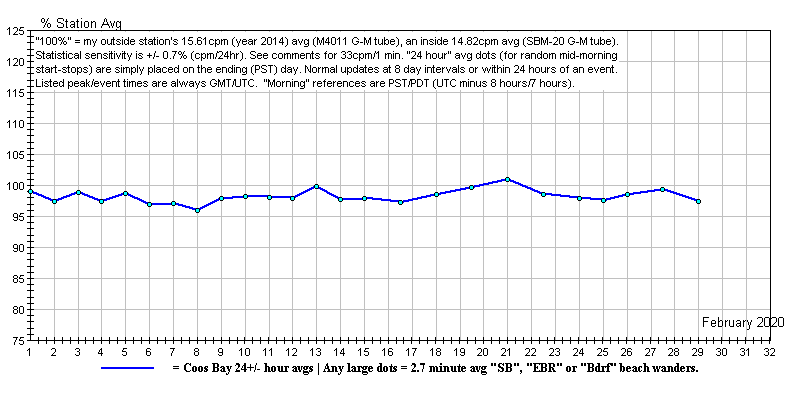
February - 2020
~ 28th: 33cpm peak at 02:43 hours UTC (isolated).
~ 29th: 35cpm peak at 10:40 hours (isolated).
~ 29th: No other threshold (33cpm) crossing peaks
as of this morning (PST/PDT).
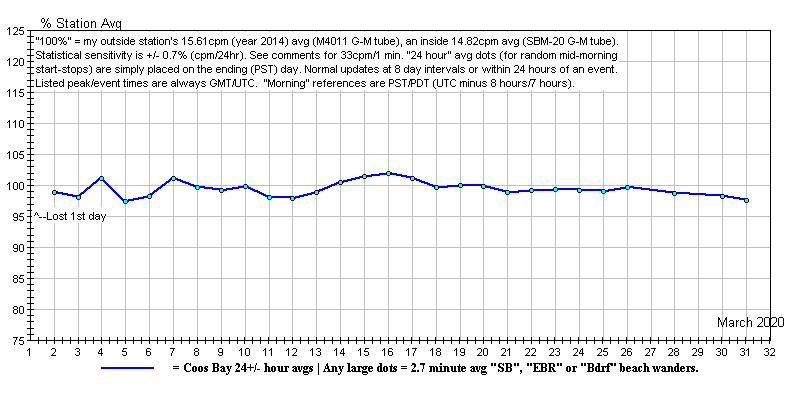
March - 2020
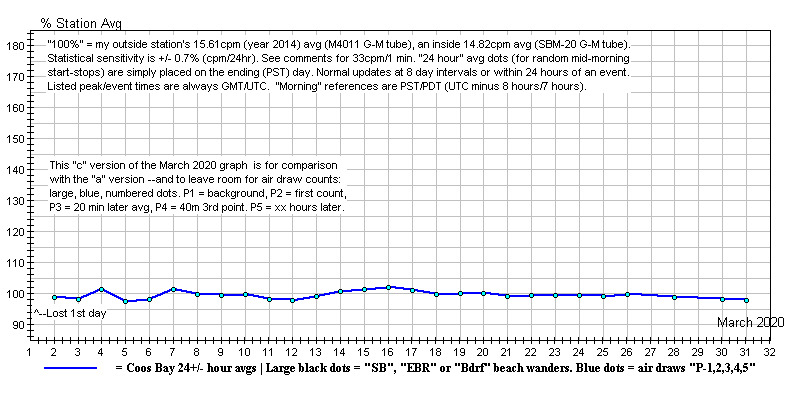 ~ 29th: 33cpm peak at 22:55 hours UTC (isolated).
~ 31st: No other threshold (33cpm) crossing peaks
as of this morning (PST/PDT).
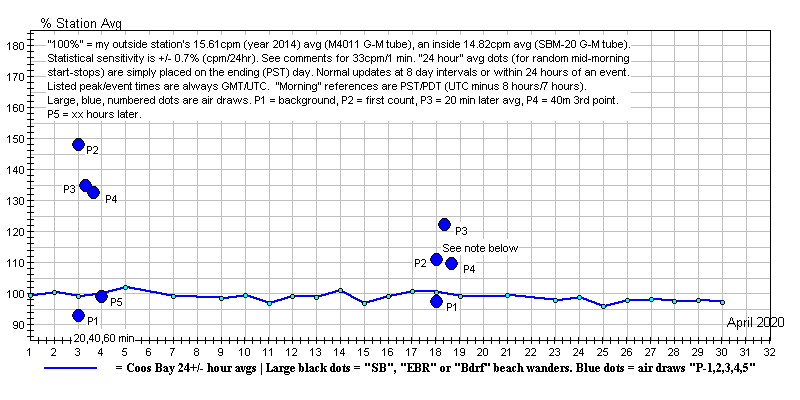
April - 2020
~ 3rd: 33cpm peak at 04:20 hours UTC (isolated).
~ 3rd: See the air sample
decay graph.
~ 9th: 34cpm peak at 16:17 hours (isolated).
~ 16th: 33cpm peak at 12:47 hours (isolated).
~ 17th: 33cpm peak at 00:44 hours (isolated).
~ 18th: Due to statistical count variations and/or
actual count variations, both in the
running
base line and the draw filter counts (note the 10 minute average trace
below),
there's no recognizable decay curve at this low level.
~ 30th: No other threshold (33cpm) crossing peaks
as of this morning (PST/PDT).

The 4/18 air draw P1-P4 counts spanned the last hour
of this (outside station) graph (click to enlarge)
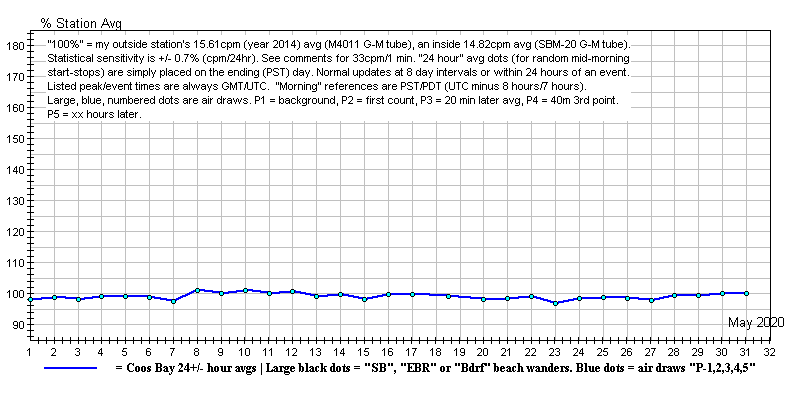
May - 2020
~ 15th: 33cpm peak at 10:46 hours (isolated).
~ 26th: 34cpm peak at 03:15 hours (isolated).
~ 29th: 36cpm peak at 04:33 hours (isolated).
~ 30th: 33cpm peak at 03:28 hours (isolated).
~ 31st: No other threshold (33cpm) crossing peaks
as of this evening (PST/PDT).
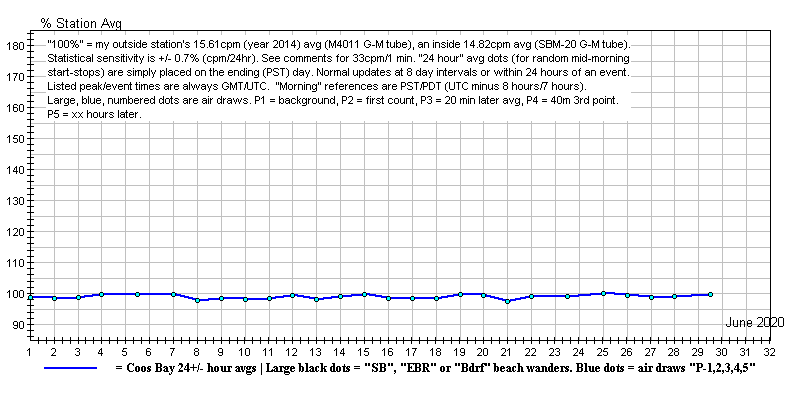
June - 2020
~ 19th: 34cpm peak at 14:21 hours (isolated).
~ 30th: 34cpm peak at 11:52 hours (isolated).
~ 30th: No other threshold (33cpm) crossing peaks
as of this morning (PST/PDT).
July - 2020
~ 3rd: 33cpm peak at 10:53 hours (all UTC) (isolated).
~ 10th: 33cpm peak at 01:04 hours (isolated).
~ 11th: 34cpm peak at 03:58 hours (isolated).
~ 16th: 35cpm peak at 13:25 hours (isolated).
~ 17th: 37cpm peak at 10:09 hours (isolated) --no
build-up).
~ 28th: 33cpm peak at 10:04 hours (isolated).
~ 31st: No other threshold (33cpm) crossing peaks
as of this evening (PST/PDT).
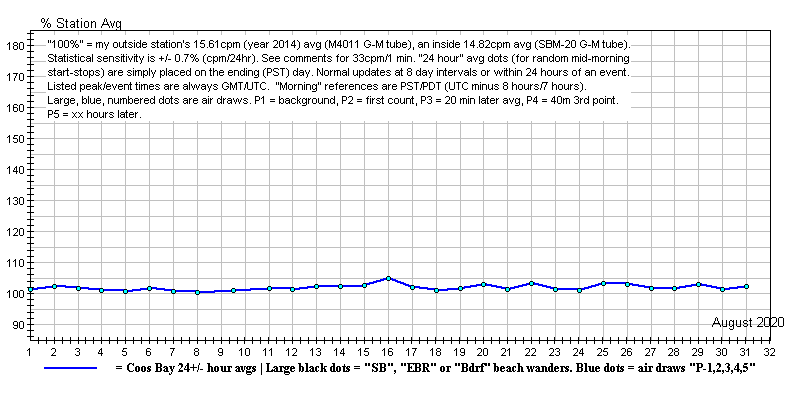
August - 2020
~ 4th: 35cpm peak at 15:14 hours (all UTC) (isolated).
~ 16th: Saved a normal looking (if somewhat high
day's average) screen capture.
~ 22nd: 33cpm peak at 08:41 hours (isolated).
~ 31st: No other threshold (33cpm) crossing peaks
as of this morning (PST/PDT).
September - 2020
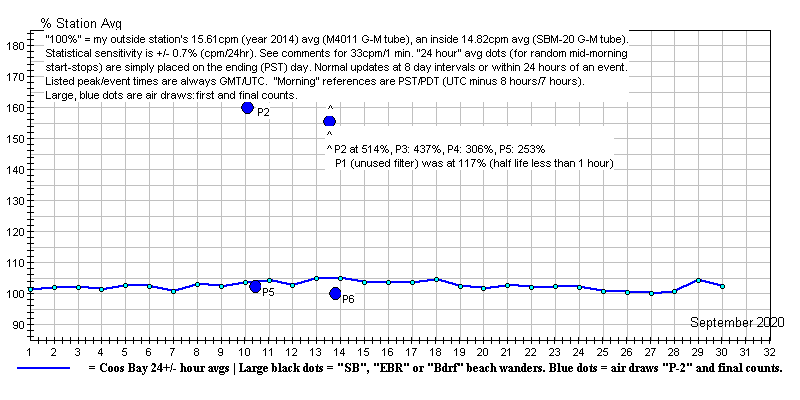
~ 1st: 35cpm peak at 12:15 hours (all UTC) (isolated).
~ 8th: Smoke from Oregon's forest fires
blotted out the Sun at local noon, seemingly replaced by fog (and
smoke)
on the morning of the 12th (as I type this note). Although an air draw
filter (at 00:30 hours
on
the 10th - UTC) showed a significant count (with an unusual decay curve/step),
my daily 24 hour
averages
were barely affected (implying mutations and beta in the filter --see the
blue P2 & P5 dots).
I washed
the exterior of the outside station's housing on the morning of the 11th,
but the subsequent
count
downturn doesn'tseem statistically significant.
~ 10th: 33cpm peak at 06:11 hours (isolated).
~ 11th: 33cpm peak at 16:17 hours (isolated).
~ 13th: This morning's count was running at 108%,
so I did another air draw, getting a high (but not record)
count
from the filter and a decay curve more typical of radon daughters. (No
rain here for a long time,
and
little or no sunshine on the sand and soil --so it has to be coming in
with the smoke --sourced
100
miles away, where the radiation must be pretty high.) The day's peak minute
count was only 30.
It's
my guess that our intense Oregon fires are liberating radon from forest
floors.
~ 17th: 33cpm peak at 09:32 hours (isolated).
~ 19th: 35cpm peak at 07:53 hours (isolated).
Smoke has cleard with rain.
~ 28th: 34cpm peak at 09:28 hours (isolated).
~ 30th: No other threshold (33cpm) crossing peaks
as of this morning (PST/PDT).
October - 2020
~ 2nd: 33cpm peak at 14:53 hours (isolated)
(all UTC).
~ 16th: Apologies! --I made a 16th day update
graph but didn't post it this month, (Getting old.)
~ 27th: 34cpm peak at 14:40 hours (isolated).
~ 31st: No other threshold (33cpm) crossing peaks
as of this morning (PST/PDT).
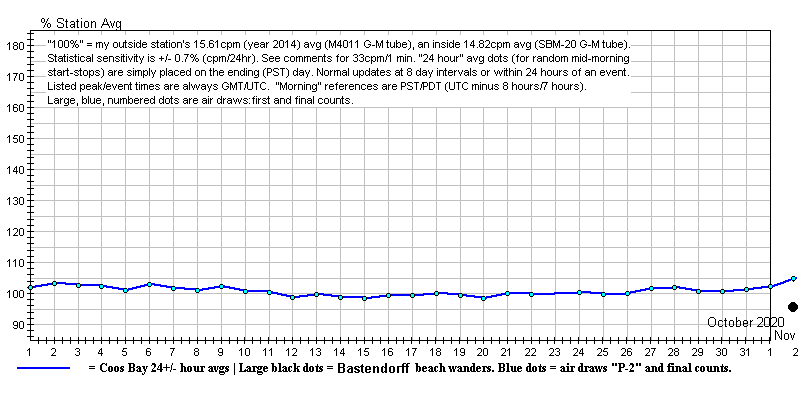
November - 2020
~ November 2nd: I did a "base
line" beach wander today at 22:15 hours UTC. These wanders/walks will only
be on Bastendorff Beach (from here on), will follow a recent high tide
line and prominent secondary froth lines, in order to audibly detect any
discrete, gamma emitting hot particles such as "fuel fleas". (I've yet
to find any.) These will be 10 minute walks (per the Geiger counter's internal
timer) at about 30 inches above the sand. The count was 96% of normal today.
(Click to enlarge)
~ November 2nd: It became clear,
when looking at my 11/2 to 11/3 graph, that there was a minor event centered
on 18:00 hours UTC (late morning -PST- of 11/2 here, displayed as "6pm"
UTC on this graph). The 10 minute and 60 minute averages reached 20cpm
(128% of normal, that small circle on the November graph), then took about
90 minutes to settle down (and in plenty of time for my "beach wander").
Never the less/more, the 11/2-11/3 24 hour average ended up at only 103.2%.
(The previous 24 hours averaged to 104.9%.) (I might have missed previous
such events/waves. I have no idea of its significance, or even of what
I'm counting.)
~ 3rd: 34cpm peak at 22:24 hours (isolated)
(all UTC).
~ 9th: 33cpm peak at 14:59 hours (isolated).
~ 21st: 34cpm peak at 19:47 houea (isolated).
~ 23rd: 37cpm peak at 01:19 hours (isolated).
~ 29th: 34cpm peak at 18:34 hours (isolated).
~ 30th: No other threshold (33cpm) crossing peaks
as of this morning (PST/PDT).
(See also: current/recent monitoring)
Notes and Comments
* January 31st, 2020: Japan has
decided to slowly drain the vast storage of radioactively contaminated
water --into the ocean. If the "linear" theory of radiation induced casualties
is correct, slow or fast release (over a wide range of rates) will make
little difference to the collective health of peoples who harvest sea food.
a kilogram of a radio nuclide, dilluted into a million kilograms of water
will damage/sicken people at rate "X", while the same kilogram, dilluted
into 100 million kilograms of water --will damage 100 times as many people
at the rate of 1/100th X.
March 31st update: After thinking on it (the above
paragraph), the more concentrated release might damage fewer people, do
to "wasting" much of the contaminant as over-kill. It's just the news headlines
which would look worse.
* The May 18, 2017 edition of Space
Weather (use their archives retrieval utility, top right of page) carries
an article describing the recent discovery that very low frequency radio
communications to our nuclear submarine fleet also resonate the Earth's
magnetosphere, forming a belt around the Earth. That belt appears to be
offering protection to satellites (and space farers?) against "killer electrons"
--presumably born of primary cosmic rays. That outcome is an accidental
byproduct of (what I gather to be) near 24/7 radio transmissions since
the 1960s, so we might not have ever been able to study the Earth's normal
deployment of its magnetic field and radiation belts.
What I want to know: if high energy
electrons (beta radiation) can be "killers" of space electronics, then
tell me more about
muons --which carry the same
negative charge, move at relativistic speed, are over 200 times more massive
than electrons, might constitute half of our normal "background radiation"
near sea level, and much more at higher altitudes. How is it that the health-physics
people assign muons the same biological impact as gamma and X-rays? (Somehow,
they're alleged to shed/impact very little energy per foot of travel.)
* It looks like 1800 tons of "spent" fuel rods are
going to be sequestered indefinitely a little more than 100 feet back from
the high tide line as the San Onofre nuclear power plant in California
gets fully decommissioned. At least it will be out of the poorly protected
pools, but this stuff must be kept safe for thousands of years, since spent
fuel is a far worse radioactive hazard than fresh rods. If I read the news
correctly, the outer containers, made of 5/8" stainless steel (instead
of the European standard of 20 inches), will only be half buried --perhaps
due to the water table. (Stainless steel deteriorates in a watery environment,
which is why maritime hardware is made of bronze.) Be my guess that, with
the rising sea level, corrosion will make the containers and their contents
un-moveable, long before a permanent nuclear waste repository has been
completed. Are property values within a 50 mile radius already dropping?
* An item
--from the Bulletin of the Atomic Scientists. (But
they missed citing the Fukushima detonations!)
* For those of you following my graphs, feel free
to email me when an item on this page is out of place, out of date, gone
missing or wrong. I normally update my graphs at 8 day intervals or within
24 hours of an event.
* My (steep slope roof) sheltered, sealed and desiccated
outside
monitoring station humbly emulates those used in Germany.
While I have a bench setup for the consistent
(if not accurate) reading of beta and gamma from samples and air filters,
I attempt to avoid counting beta (and I can't count alpha) radiation with
my outside station or my "walks", since that would only serve to inconsistently
mess with the totals --having more to do with wind and rainfall than any
presumed artificial radiation content. (If my outside count goes up, I'll
do some
air readings again.)
The "Preamble"
to this page:
* 11/03/2021 up/backdate: Here are links to "what are
we counting" discussions elsewhere which might interest you:
* (December 3, 2014) in a 0.10 uSv/hr field,
the long term average of my GMC-200's M4011 tube comes out to about an
even 16cpm --same as the SBM-20 tube in my Radex-1503. The less-than-optimized
SBM-20 that I retrofitted into a Medcom "Inspector" clicks at about 15cpm.
The Inspector's original LND-7317 pancake tube would click at about 35cpm
in that same field.
> https://www.gqelectronicsllc.com/forum/topic.asp?TOPIC_ID=4099
* (December 13, 2014) Some say that even at sea level
(MSL), about half of my count is muons. (Others say that muons hardly register
on a standard Geiger counter.) With a high energy capable scintillator,
the density runs about 1/cm^2/minute which pencils out close to MSL background,
given the profile of common G-M tubes. / G-M tube manufacturers specifications
commonly cite what Id call a noise level, but what they call own,
inherent, self, or shielded background levels that approach or exceed
commonly logged MSL background radiation
> https://www.uradmonitor.com/topic/what-the-heck-are-we-counting/
* (January 21, 2015) We get a noise figure of "0.2cps"
= 12cpm (which no one wants to talk about), but nowhere do we see the stated
gamma sensitivity. I see companies which use LND G-M tubes stating sensitivity
in a calibrated 1000uR/hr field of cesium-137 radiation --which lobs the
count way above any contested levels of internal noise and/or local "background"
levels. Those of us doing low level background monitoring then interpret
(say) a spec of 3500cpm at 1000uR/hr --to meaningfully indicate 10 uR/hr
(0.10 uSv/hr) at 35cpm.
> https://www.gqelectronicsllc.com/forum/topic.asp?TOPIC_ID=3664
* (January 2, 2017) I measured background (18.1 CPM
here in Germany, measured over 1 day) and then tried to reduce background
by shielding the device. Thick layers of cardboard, a tin box, a lead bag
(from the times when you had to get real photographic films through the
airport scanners). Not much success; the background barely changed.
> https://www.gqelectronicsllc.com/forum/topic.asp?TOPIC_ID=4421
(April 30, 2020) I am wondering if the GMC-600 Plus
firmware/calibration routine accounts for the internal noise / counts of
the GM tube? / The more sensitive the tube is, the higher the noise is
going to be. For an example - the GM tube used in GMC-600Plus is LND 7317.
LND Inc specifies this tube as max of 30 CPM under heavy shielding conditions
(50mm Lead + 3mm Aluminum).
> https://www.gqelectronicsllc.com/forum/topic.asp?TOPIC_ID=9062
* 6/12/2019 update: This section asks: "just what
is it that I'm counting?" --and I'm still not sure. Recently, the Sun entered
a quiet period --perhaps to become an extended "minimum" (the spot count
and flaring goes to zero). As a consequence, high altitude cosmogenic radiation
counts (including neutrons) have gone up --since the solar wind has diminished
--along with its ability to run interference for us against in-coming primary
radiation (particles, protons, whatever). YET: my counts have not gone
up --which you'd expect if the cosmogenic (muon) count is more significant.
On the other hand, many marine studies, and studies
which rely upon the radiation stopping power of the ocean's deep --indicate
that "background" gamma radiation (at least with high quality scintilators)
is largely cosmogenic/atmospheric --which agrees with my own subersion
experiments. (The nut of my efforts: I got a healthy background count with
my Geiger counter suspended just above our bay --so earth wasn't my source,
but the count was significantly reduced when submerged [well clear of the
bottom].)
Here's a professionally executed example: "Environmental
Gamma-Ray Observation in Deep Sea" by JAMSTEC (Japan Marine Science and
Technology Center, Japan Agency for Marine-Earth Science and Technology),
published in 2012 --a PDF that you can Google up.
I don't know how much is contributed by the internal
noise of my (very affordable) Geiger-Mueller tube (all the spec sheets
suggest much noise). Perhaps there are significant contamination/noise
differences from tube to tube --up to a spec sheet maximum, which would
become evident when comparing low level "background" counts between G-M
tube samples.
* 10/27/2018 update: A 5 year-long string of inquiries^,
tests, monitoring methods, 3 Geiger counters, discussions and reading parts
of Glenn F. Knoll's book: RadiationDetectionand Measurement --at
first led me to subtracting an apparent "noise" component from my counts,
only to finally go back to whole count averages.
* I became satisfied that the G-M tube noise component
(what remains after shielding out all that one can, which is about half
of a normal "10 uR/hr" count here) --is largely due to secondaries and
tertiaries from cosmic (sky/space) radiation.
** However: Student balloon runs (October - 2018) reported
(at Spaceweather.com) 20% and
higher increases in cosmogenic radiation at stratospheric altitudes --and
I didn't see an increase in my station counts.
* I've read that the cosmogenic stuff is about 80%
muons (near mean sea level --I'm at MSL+90 feet here) --to which health-physics
assigns the same biological impact as ordinary gamma rays (despite their
speed, charge and mass). Counting efficiency is near 100% for higher energy
beta (electrons), so I'd expect muons, which carry the same charge plus
they have 200x the mass, would also count well --but they're said to shed
little ionizing energy as they travel --at relativistic speeds.
* What this comes down to: all I know for sure is *click*
*click* *click* and how much my click count rate varies.
* Note --that my counts have been in the +/-5% range
for years --and what does that tell us?
* Earlier, I revised the several (noise
subtracted) 2016 graphs I'd made, bringing them in line with the whole
count graphs of recent years and all graphs since.
* I've also dispensed with specifying "standard deviation"
and multiples/probabilities there-of. The count is made up of disparate
components and I just don't know how valid it is to base that on a simple,
total count.
** My thanks and a shout-out to Dr. Martin Bleher of
Germany's Federal Office for Radiation Protection (Bundesamt für Strahlenschutz),
who addressed my long standing questions. Dr. Bleher could, of course,
only speculate on their own G-M tube "noise" components, and although he
didn't directly state as much, I gathered that they log all the clicks,
which are then presented to the public as so many (current) uSv/hr "dose
rate" units --without distinctions or speculation
as to the actual components. (I wrote a polite note back to him with these
inferences of mine, which he has not corrected.)
* I've been aware of G-M tube noise specifications
for years, but they've always been ambiguously given as a (rather hefty)
upper limit (when shielded with 50mm of lab lead --perhaps with some interior
aluminum as well to soak up "bremsstrahlung" secondaries). I previously
couldn't get satisfactory answers about noise from those I've contacted,
nor did I trust my own methods for detecting "noise" (which appeared to
be quite high in my tests as well).
~ I suspected there was more to
"noise" than the lead shielded remainder value --and more to it than internal
G-M tube contamination, because I got another 22% reduction by submerging
a Geiger counter to a depth of 2 meters here in Coos Bay's bay. (I
used 8 pounds of lead in my simple pressure vessel --not intended as shielding,
but for ballast, for whatever radioactive contamination my cheap lead shot
might have contributed^.)
^ Technicians doing professional lab work use only
quality, clean, radioactively quiet lead bricks for building their "lead
castles" --into which their samples and ultra sensitive scintillator probes
are placed. Lead shot (for loading shotgun shells), on the other hand,
is surely the worst grade of lead (blended with antimony) that you could
use --but: it's cheap, widely available, packs well, and (in thick plastic
"freezer" bags) is easy to work with. (Be sure to buy it all in the same
pellet size, at the same place, and at the same time, such that it's homogenous
and always packs the same --for consistently effective shielding.) Perhaps
lead shot is good enough for shielding the amateur's G-M tube.
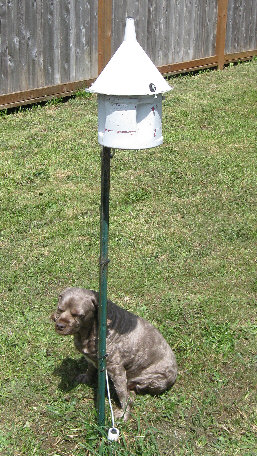
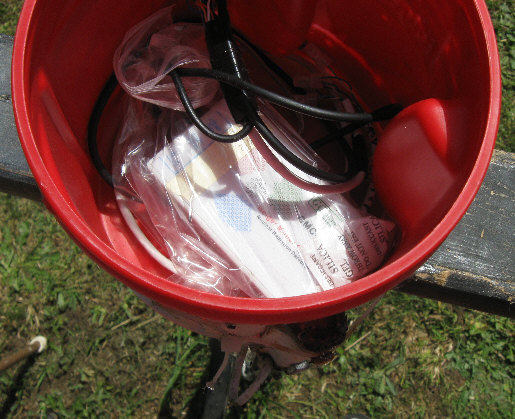
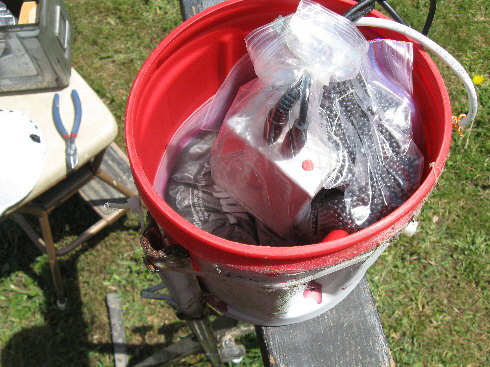
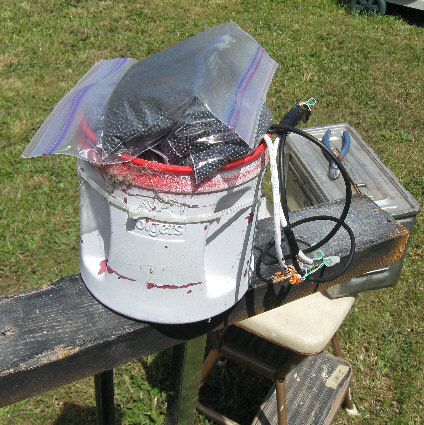
My outside Home Station --loaded up with lead shot
for a "noise" test.
* My noise inquiries entailed postal letters, email
and web site feedback utilities. I contacted several "ask a scientist"
venues (including Firmi Labs, which sent me a nice response), the Nuclear
Physics Department of the University of California Berkeley campus (which
invites such questions, but no response after 4 tries), Bundesamt für
Strahlenschutz (a nice response years ago, and now again [thanks!]), two
university campuses here in Oregon (one very nice response from a department
secretary), several Geiger counter manufacturers and dealers, and (of course)
the groups and "web people" which the monitoring community is close to:
Safecast, Radiation Network, Fairewinds, Energy News, "Anti-Proton", Citizen
Scientist League, Robert Hart ("Hardhack"), LND (indirectly), Aware Electronics,
and others --with several good (if somewhat contradictory) responses.
(I'll try to update what follows, but will leave
the original date when it seems best to do so.)
* (2016) I'm continuing with the
daily monitoring of 1 minute counts and 10 minute running average counts,
archiving any unusual daily automatic graphs (via an off-line, beta edition
of GeigerGraph-5). Each morning I look at a graph display to see if there've
been significant departures or trends away from my station's (January 2014)
base line average of 15.77cpm.
~ These past two years I went from
33cpm to 32cpm and back up to 33cpm again --for the 1 minute "alert level"
that I've set into my data logging. I visually (and more sensitively) look
for trends and my 10 minute alert level (now 22cpm). Since there's a "Poisson
distribution" of counts around my station's long term average,one might
expect to see isolated, one minute long, 32cpm counts to occur every day
by random chance alone. (although I no longer (as of 2016) cite graph excursions
as so many standard deviations/"sigma", I've done the mean/variance calculations
for a large number of counts and their distribution agreed fairly well
with the statistical Poisson assumption.)
** As of October 10th, 2015 --and being ever so weary
of accommodating DST changes to my radiation and astronomy date stamps,
I standardized my computers to "UTC": "Co-ordinated Universal Time", which
(I think) is the same as GMT minus any DST happy horse-shit. (All USA clocks
should run on UTC or some other single time standard --as they did across
the old Soviet Union.)
General reminders:
* My radiation charts are updated at 8 day intervals,
or within 24 hours of an event.
* Per my corrections of January,
2014, "100%" was set equal to an outside station average of 15.77cpm (using
a glass M4011 G-M tube), then corrected again to 15.61cpm
(due to a net 1% long term contradiction between the Spread Sheet and the
"Report" logging of the software I'm using). It works out that the graphs'
continuity has not been affected.
* This "100%" represents the long term averaged count
for my outside station. It would correspond to (about) 36cpm from a typical,
"pancake tube" (LND-7317) equipped Geiger Counter (say: a Medcom brand
"Inspector") --placed in a steep roofed, plastic sealed shelter, at a meter
off the local ground^. It also represents about 16cpm from an LND-712 equipped
Geiger counter, or an indicated "10uR/hr" (10 micro-Rem per hour), or "0.10
uSv/hr" (micro-Sieverts per hour) --from any Geiger counter with a (meaningless,
but roughly cross-Geiger counter equalizing) indicated "dose" display.
^ I've several times compared long period averages
between my outside station and a test bed location in my office, getting
the same results (meaning: they were within an expected narrow range of
statistical departure). Were we to suffer significant fall-out from a radiological
event, no doubt the steep roof of the outside station's shelter would shed
particles faster than the roof of our house, but both would provide an
alert.
* There's pretty good agreement among monitoring stations
along the west coast of the United States, per this June, 2017 "uRAD" monitoring
map:
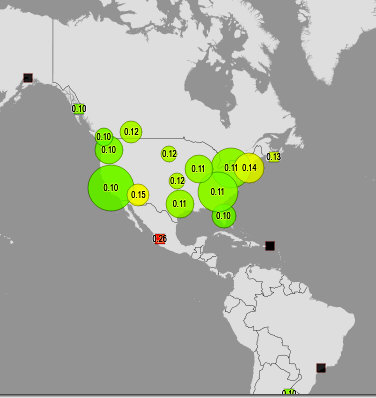
(Ctrl+ to enlarge this image.)
(No: I don't know why the circles are differently sized.)
* Note that typical "survey" Geiger counters and their
Geiger-Mueller tubes are commonly calibrated and/or rated at 1000 uR/hr
(using a cesium-137 source at a specified distance), and were originally
intended for such high level readings as might be encountered during triage
after a radiological accident or attack. We (in the monitoring community)
use these Geiger counters at background levels because they're affordable
and practical (if used methodically). Again: their "dose" indications would
only be meaningful when reading Cs-137 contamination at a specified location
--but: uR/hr and uSv/hr allows us to roughly compare readings between a
diversity of such instruments (much as I'd prefer the station specific
base line percentages that I'm using).
* So: what are we actually reading? By isolating a
geiger counter in a meter-high, desiccated, gamma radiation transparent
plastic housing, CPM (or "dose") readings will hopefully be minimally affected
by natural local or fall-out beta and alpha radiation --which should be
separately attended to via the methodical (if however humble) readings
of soil samples and forced air filters. That being the case, and at such
low background levels as I've been reporting for 5+ years, perhaps over
half of the counts are due to secondaries and tertiaries from cosmic/sky
radiation --which might be mostly "muons" --which are some 200x the mass
of electrons and carry the same charge (ouch!) (ouch?).
(The following was partially updated on 7/31/2016)
Graphing modes compared^
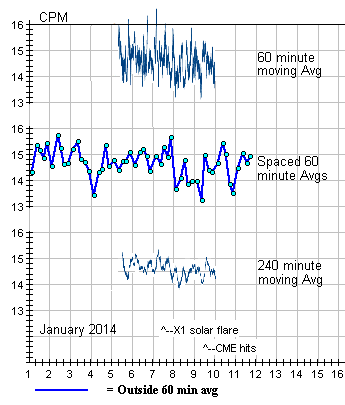
Three graphs from the same data (above)
^Since October of 2012 my custom
graphs have been rendered with the excellent (and free) "ZGrapher"
program.
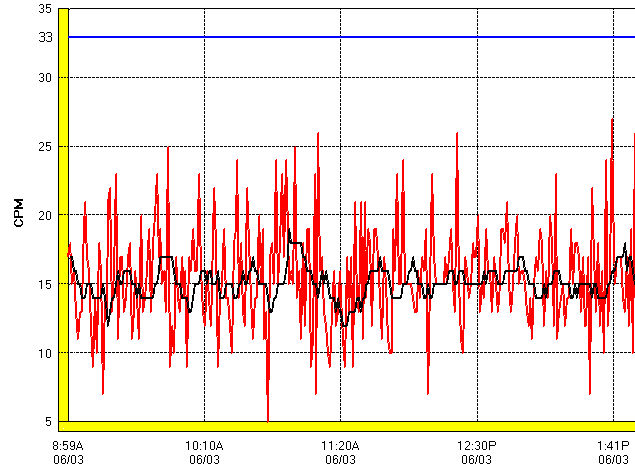
Statistically expected peaks: Here we see minute-by-minute
counts (red) and 10 minute averages (black), based on but altered (for
more visual clarity) from an early beta version of GeigerGraph-5.x. What
you're looking at is statistical noise --rather like counting how many
people happen to be passing through the gate into your county fair, per
each minute of the day. The more people and the longer the period counted,
the closer your people graph line would settle down to a longer term average.
(My station's gamma activity has a very long term average of 15.61cpm.)
* For our radiation counts, we'd expect them to be within
the square root of the total count --about 68% of the time (that is to
say: within plus or minus one "standard deviation"^ for 68% of the time),
which total count you'd then divide by the number of minutes in the period
counted --for the average CPM. Notice how the red line excursions appear
to be something like 3 times wider than the 10 minute averages. The square
root of 10 is about 3.16.
^ However: I've stopped referencing standard deviations
(or so many "sigma") since gathering that these counts are made up of very
different components ("NORM", cosmogenic, plus any "fall out" that we worry
about). All I know for sure are my count totals, what I'm using for Geiger
counters, and how/where they're located. I strongly suspect that I'm not
alone in this and that very few people have a good handle on what drives
their low level "background" counts.
* The several kinds of averaged graphs I've generated
(manually and with graphing programs) all look different. I don't like
any of them, so I might as well stay with what I've been doing (takes 5
manual operations), despite its tendency to miss events and produce statistical
artifacts. Again: I see the maximum CPM for each day, I investigate the
spread sheet and report on those which reach 33cpm or higher --so as not
to miss anything egregious.
* 33cpm might seem rather high (4.4 "deviations" --from
whatever) --but there are 43,500 minutes counted each month, and it's turning
out there's (seemingly) about a 1 in 10,000 chance of a count running that
high on the (valid or not) basis of the above described statistical noise.
Usually, I find that in the 10 minute period surrounding such an event,
the peak is isolated --and that the period's average isn't otherwise elevated.
* Never mind the oddly pointy and square topped shapes
of the 10 minute graph line --per:
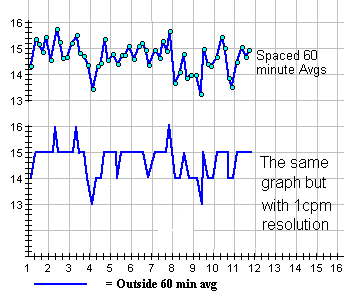
Graph Resolution
* Some of the available Geiger counter vendor graphing programs
only offer 1cpm resolution, which results in that square and saw tooth
wave appearance. My long term averaging and the situation here on the coast
of Oregon (atypically calm?) are such that my graphs require at least 1/10th
CPM resolution (I go 1/100th) in order to make out trends and to discern
apparent spikes/dips from among the "statistical noise" ("wiggle", "grass",
"Poisson distribution") which is always present.
* Try to avoid line graph displays which attempt to pretty-fy
the results with such as 3-D effects, gradient color backgrounds, garishly
colored fat lines and grids. Simple, jumpy, black-on-white radiation graphs
are hard enough to interpret as it is.
Here's an illustration of the radon
decay chain:
 Normally, I filtered out the alpha
(before my Medcom "Inspector's G-M tube went flat), so those lead-214 and
bismuth-214 components melded to give a typical half-life of about 40 minutes
(which varied a bit, depending on how long I waited to time it). When I
use to read the
alpha as well, however, the 40 minute
decay went down to 29% of the initial CPM (again: using my Medcom "Inspector"
Geiger counter).
Air Sampling:
Normally, I filtered out the alpha
(before my Medcom "Inspector's G-M tube went flat), so those lead-214 and
bismuth-214 components melded to give a typical half-life of about 40 minutes
(which varied a bit, depending on how long I waited to time it). When I
use to read the
alpha as well, however, the 40 minute
decay went down to 29% of the initial CPM (again: using my Medcom "Inspector"
Geiger counter).
Air Sampling:

* Originally, I used this Oreck vacuum cleaner (from
our Goodwill Store) to
pull about 20 cubic meters of air through a 2 inch
(exposed) 3M brand N95 filter patch in one hour.
(Note that 3/8 inch bypass hole, such that the vacuum's
motor gets enough air to not over-heat.)
 4/1/2020 update: This is the filter
I used earlier. It measured 1-3/4" diameter ( 1-1/32" exposed to air flow).
At left is the filter unit: a standard 1 inch PVC union fitting (I now
use a 2 incher). Next is the assembled filter --about to get its weather
head. Finally we see the filter/intake as it was originally located high
above the porch rain gutter, but now it's only 26 inches higher (and 115
inches above ground level, measured to the bottom of the weather head),
so as to survive our winter storms. (It's thanks to James Hollen for that
plastic pipe union idea.) My filters were cut from face masks, so to keep
them from humping up in the test well/chamber (imaged just below), I cut
them down after the air draw to just the exposed diameter.
4/1/2020 update: This is the filter
I used earlier. It measured 1-3/4" diameter ( 1-1/32" exposed to air flow).
At left is the filter unit: a standard 1 inch PVC union fitting (I now
use a 2 incher). Next is the assembled filter --about to get its weather
head. Finally we see the filter/intake as it was originally located high
above the porch rain gutter, but now it's only 26 inches higher (and 115
inches above ground level, measured to the bottom of the weather head),
so as to survive our winter storms. (It's thanks to James Hollen for that
plastic pipe union idea.) My filters were cut from face masks, so to keep
them from humping up in the test well/chamber (imaged just below), I cut
them down after the air draw to just the exposed diameter.
* Given the high demand/need for N95 masks now (re:
the Covid-19 pandemic), I've offered my remaining N95 masks to a local
clinic and am considering coffee filters. They're sold cheaply: 200 in
a package. I've seen them rated as passing up to 15 microns. Looking at
a Melitta brand "Super Premium", "Natural Brown basket filter, I see a
sparse scattering of holes up to 36 microns, but nearly all of this paper
fabric has much smaller pores, mostly just a few microns or less. I don't
think the wee bit of 15 to 36 micron bypass matters, since I'm not trying
to protect anything. I just want to catch some of the finer stuff and put
it under a Geiger counter.
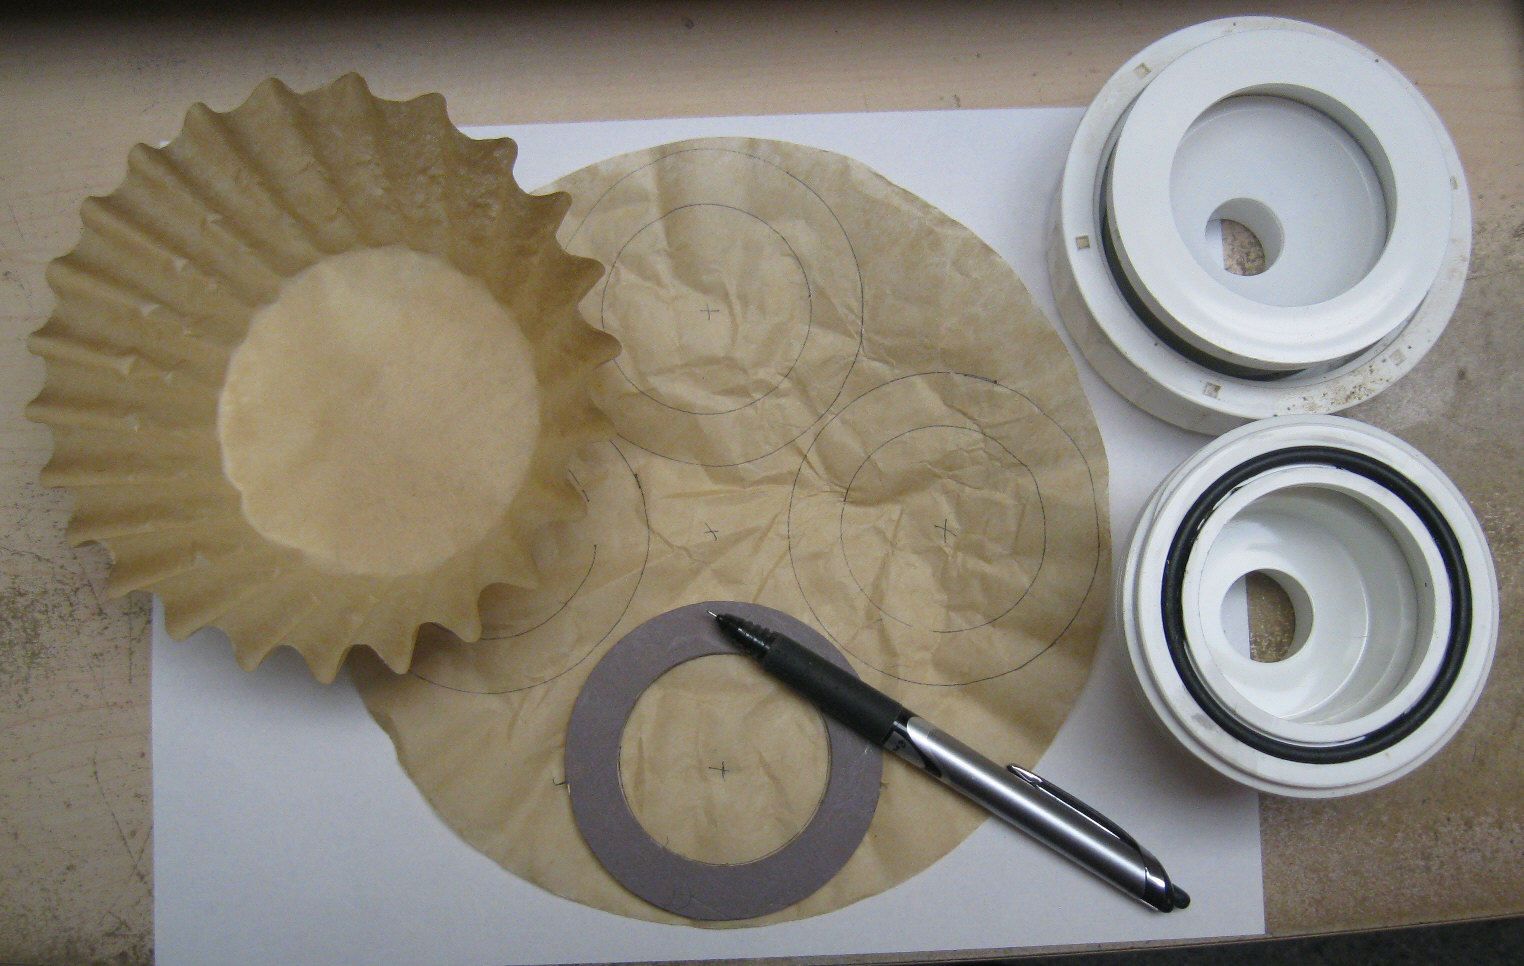 * In my case --counting only gamma and hard beta, I could
sandwich two coffee filters together and be confident of micron level filtering
--but (again) I'd have 99% plus micron level catching with a single layer.
We'll see if I need double thickness for strength.
* In my case --counting only gamma and hard beta, I could
sandwich two coffee filters together and be confident of micron level filtering
--but (again) I'd have 99% plus micron level catching with a single layer.
We'll see if I need double thickness for strength.
* 4/4/2020: Single thickness coffee filters are holding
up fine. My initial air draw runs are producing a radon rate decay rate,
as did my earlier work.
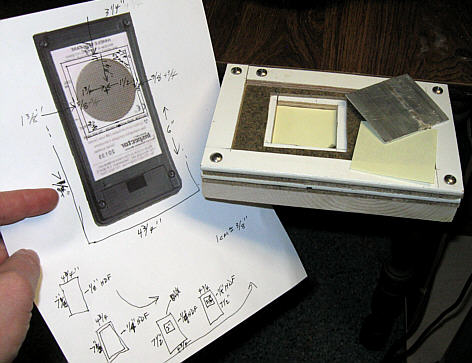
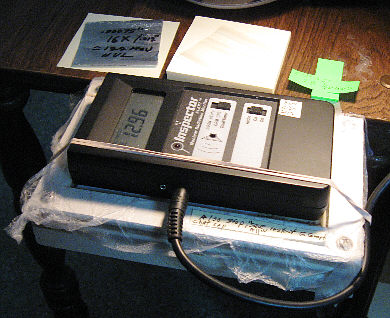
My test bed's well has shoulders to space samples and
filters about 1/4 inch from the Geiger counter's screened window. The stepped
aperture, 1/8" above the well floor, is for landing that aluminum plate.
I could then subtract softer beta and alpha from the gross count. (But
there's no longer any alpha detection. Despite my tender loving care, this
Inspector's G-M tube failed at 14 months, so
I retrofitted
it with an SBM-20.)
* It's been a very long time since
I've done air draws (due to my Geiger counter's pancake tube failure and
having removed the Oreck vacuum to other purposes). Since I'm using coffee
filters now, there's no need to recalibrate my air draw rate, as long as
I keep my methods and minutes the same. Note that these decay rates are
only for gamma and hard beta detection. Best I do morning air draws, simultaneous
with the morning restart of my outside station's count --so I have a direct
comparison over the first 20 minutes (along with the inside station background
count).
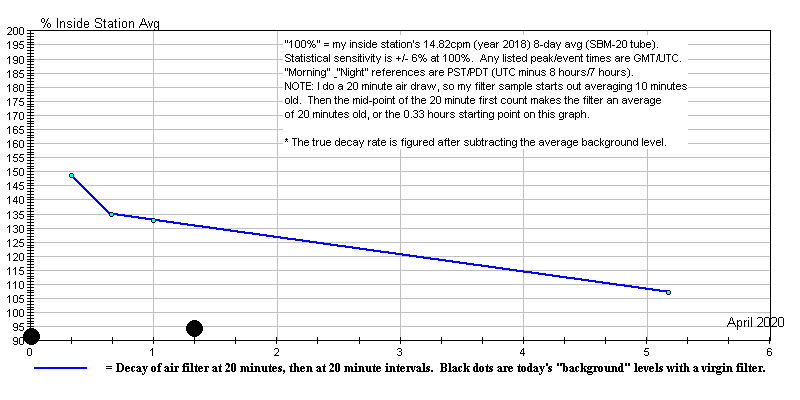
The date should read: April 3rd, 2020
* Those big black dots suggest the variability range of
my counts, due to the statistical randomness with which
gamma photons happen to cross the little Geiger-Meuller tube in my detector-counter.
* At 31 hours the 4/3 filter count was at 93.1% (actual
20 minute average: 13.8cpm). At 32 hours: 101.6% / 15.1cpm. The virgin
filter: 102.2% / 15.2cpm. The total counts were about 300 ("N"), so the
expected "sigma" count distribution is something like +/-6%. (I'm not at
all expert on this.)
~~~~~~~~~~~~~~~~~~~~~~
Checking Food
(4/26/2015 update)
* Peter Daley of Australia has made me aware that the
risk of food contamination extends to serious, gamma emitting particles
--aka: "hot particles" or "fuel fleas", for which a common Geiger counter
could be a life saver. There are accounts of such particles to be found
across the Internet, some of them active enough to affect a basic Geiger
counter several feet away. (I'm talking a steady, penetrating, "this can
of tuna for sure, not that one" count of hundreds or thousands of CPM.)
Thankfully, such occurrences are extremely rare. I've
seen nothing but normal "backgrounds" here after 5+ years of daily monitoring
(plus a neighbor who came home loaded with radiation from medical imaging).
For a long while I made an effort to discretely carry a compact Geiger
counter, especially when I went grocery shopping.
* If you decide to do that, I suggest minimal beeping/clicking
and no theatrics. If the alarm sounds, switch straight to silent mode and
mutter something about "damned cell phones" --but locate, and remove the
hot item, mark it poisonous, write down (or photograph) any identification
on the food item, what radiation reading at what distance, the manager's
name, date, time --then attempt to interest the store's management and
the hazmat crew of your local fire department.
* Unless you have a nearby lab to properly test it,
I don't suggest that you purchase the food item, since it then becomes
your responsibility --to competently and securely isolate the item, preserve
and document its "chain of possession", and make certain that matters are
properly attended to by the proper authorities.
* More on Peter Daley's resources, which include a
volume of advice and links concerning radiation and food. Good starting
points are:
The Food Lab: http://sccc.org.au/archives/2861
> http://sccc.org.au/wp-content/uploads/2012/06/How-to-set-up-a-home-or-community-food-testing-lab-for-radioactive-contamination.pdf
> http://technologypals.com.au/wp-content/uploads/2012/03/Using-a-Geiger-Counter-to-test-food-for-Radioactive-Contamination.pdf
* So: a Geiger counter does not, of course, have the
sensitivity or discrimination to pronounce any food stuffs as being safe
to eat. Neither can a Geiger counter condemn a food or beverage item --unless
it's plenty hot --way hotter than the (mostly beta) CPMs you get in close
proximity to (say) potassium chloride (dietary "salt substitute").
* Proper food monitoring requires spectrometry on the
(often incidental) gamma radiation involved, which takes honorable equipment,
handling methods, lab discipline, and learned, seasoned experience.
* Gamma emitters seem (to me) to be the only practical
isotopes for an amateur with a Geiger counter to check for. Beta radiation
is nearly all blocked by the moisture content and even the food's own bulk.
When desiccated and/or thinly sliced, the available (and natural) potassium
sourced beta count of many foods increases considerably, but that can swamp
any count you're getting from serious traces of other polluting radio nuclides.
* Be very careful not to contaminate your Geiger counter
when checking samples, when the air is not clean, and when at the beach
(wind, spray, alluvial sand, salt air). Bagging it in a Ziploc is a good
idea (but place a packet of freshly charged desiccant inside with it, or
at least open and let the bag/counter breath after its back home,
warmed up and safely stored).
Since 2017 there's been a new push to rehabilitate
nuclear power. One of the leading designs (backed by Bill Gates) seeks
to revive the 60 year-old notion of using high temperature, corrosive,
flammable, molten sodium instead of water in the primary cooling/heat transfer
loop. A sodium cooled test plant underwent our nation's first (and worst?)
nuclear power meltdown in 1959. This probably comes as news to you because
it was kept under wraps for 20 years. See:
> https://data.nbcstations.com/national/KNBC/la-nuclear-secret/
> https://www.commondreams.org/views/2019/07/13/60-years-largest-us-nuclear-accident-and-captured-federal-agencies
The Solar Flare Threat
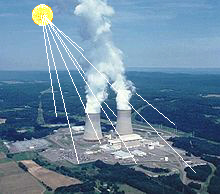
January 5th, 2017 update: We made it through! (I think)
3/21/2015 update: Have we made it through the worst of
this solar cycle? I sure hope so.
3/06/2014 update: Here's a *link*
to a 3/4/2014 Wall Street Journal article by Rebecca Smith --which
might display in full the first time you access it --but which might subsequently
fade out. Apparently, this is the WSJ's new way to game us into subscribing),
with more recent information on the availability of replacement EHV transformers.
We do have a domestic manufacturer who can build the big ones (400 tons
each! --similar to the largest stones in ancient megalith monuments), but
it takes months to complete and deliver one. A recent delivery from an
overseas source took about 2 years. (Hat tip to Majia for this information.)
3/15/2013: Either the 2012-2013 solar maximum
will be unexpectedly tepid, or it will come as a delayed "double peak".
Watch the video at NASA
Science News. Prevailing opinion favors a repeat of the double peaks
we've seen in the last 2 solar cycles. (That video also reference a
double peak during solar cycle #14 [early 1900s], but I didn't see one
in the record that I looked at.)
If we do get a double peak, the second one might have
us weathering a series of "X-Class" flares and coronal mass ejections ("CMEs").
Whether one of them smacks the Earth and shuts down some of our power grids
is a game of "Russian roulette".
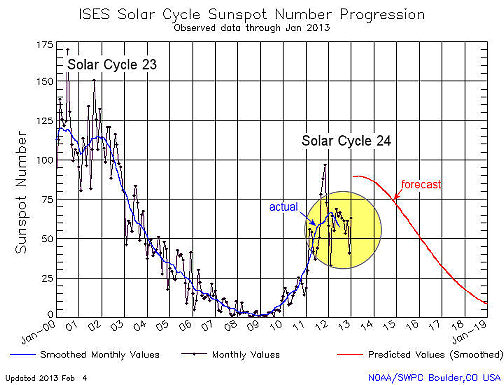
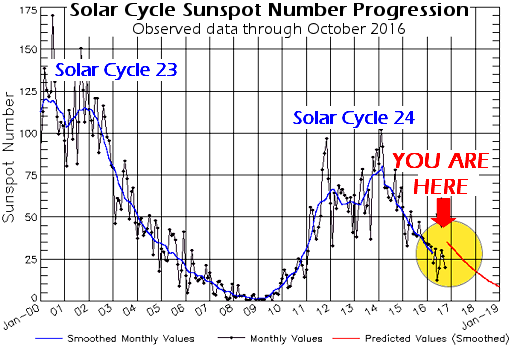
10/31/2016 update --thanks to: NOAA, ©2016 Spaceweather.com
and Dr. Tony Phillips (w/o permission).
11/17/2016: Well: we got a "double peak", but we made
it through anyway, and seem to be in the clear for some long while again.
Never-the-less, I think --
It's
vital that our political leaders understand and address the following
points. (Good luck on getting through to them, but one recent presidential
candidate pledged to phase out nuclear power: the Green Party's Dr. Jill
Stein.)
* Nuclear power plants, despite that they might end
up literally bursting with thermal energy, were designed such that they're
unable to power their own cooling pumps --in the event that there's a local
failure of the power grid. On-site diesel-electric
backup power then takes over to run the pumps, controls and instrumentation.
* I know that's hard to believe, so rather than simply
discounting my concerns here, please confirm it for yourself. Google on
"station blackout".
Newer designs use steam power to run turbine driven
water pumps, but they still require electricity to open valves and turn
those pumps on, which is supplied by only hours of battery power.
* Because the spent fuel pools (SFPs) were only meant
to hold 1/4th or 1/8th of what was eventually crammed into them, there
was no provision to supply them with emergency backup power at all.
* To be very clear about this: there was originally
(and still?) no provision to connect the diesel backup generators to the
SFP's cooling pumps --!! The plan was to simply let the water in the pool
coast up --near to the boiling point (which might take as little as 24
hours), and to then replace boiled off water by means of manually deployed
fire hoses. (Sweetjeez!)
* The SFPs are crammed with old fuel rod assemblies
because there's no place to store nuclear wastes, and because the operator/owners
of nuclear power plants are too cheap to use "dry cask storage".
* There are several deadly important things to understand
about "spent" fuel pools and rod assemblies:
~ Their radioactivity is far more
deadly than fresh nuclear fuel rods.
~ There's serious question as to
whether their sometimes 40 year-old liners can stand the strain of boiling
water.
~ If the zirconium cladding on the
fuel rods gets hotter than 1800 degrees Fahrenheit, it oxidizes with steam
and water, releasing explosive hydrogen. Above 2000F, the oxidation process
turns into a furiously burning fire which destroys the rod, releasing its
radioactive contents.
* As to keeping a reactor's containment cool after
a shut-down, months of mechanically forced water cooling are required --but
the U.S. Nuclear Regulatory Commission originally (pre-Fukushima) only
required that nuclear power plants be independently capable of supplying
diesel-electric backup power for 72 hours, plus 4 hours worth of battery
backup power --to cover any delay in getting their diesel engines to turn
over.
~ The Fukushima Daiichi power
station reactors had 8 hours of battery backup power. They used every bit
of it.
~ The NRC might have recently
started upgrading that requirement to 8 hours of battery and more on-site
diesel fuel. The recent near nuclear disaster at New Jersey's Salem nuclear
power plant established that they had a store of 7 days worth of diesel
fuel on hand.
~ While SFPs might require mechanical/forced
cooling for a year, I don't know how long mechanical cooling is required
to remove residual heat from a normally shut down, intact reactor in order
to maintain "cold shutdown". The damaged reactors in Fukushima have required
months of cooling.
~ Backup power will continue
to be available at a nuclear power plant if more diesel fuel can be delivered
to the power plant, if the diesel generators remain operable, and if operator
personnel can be persuaded to remain at their posts. (The regular Fukushima
crew initially fled, but was successfully ordered to return. The head of
TEPCo has stated that, in the event of a fuel fire, he'd have no way of
ordering his crews to face certain death in order to mitigate the situation.)
*** A report by the Oak Ridge National Laboratory stated
that over the 40-year licensing term of a nuclear power plant, solar flare
activity adds up to a 33 percent chance of it experiencing a long term
power loss: a risk significantly greater than that of earthquakes and tsunamis
--!
* Federal government studies have suggested that extreme
solar flares could result in regional blackouts lasting months or even
years,
since critical power grid components like EHV (extremely high voltage)
transformers are made in places like India and we have scant spares here
in the United States. There are more than 300 aging, vulnerable EHV transformers
in substations across this nation and the existing over-seas manufacturers
of these transformers currently have a 3-year backlog of standing orders.
* A severe solar storm might destroy hundreds of transformers
world-wide, leaving vast populations without water, sewers, hospitals,
TV/radio broadcasts, fire and basic safety services. Military escorts would
have to bring in fuel tankers through the ensuing chaos from our strategic
reserves, since the pumps which normally transfer gasoline and diesel fuel
wouldn't be operating, nor would refineries be making more.
* I understand that nothing material has been
done to provide for the recovery of our power grid.
* As of 1/22/2012, the prediction was for a long, quiet
series of solar cycles, following the 2013 maximum. Since our nation has
already passed up years of opportunity to prepare for a solar flare disaster,
and since it would take about 3 years to prepare if we'd started in 2013,
there were only two meaningful things to be done.
1) Shut down all nuclear power plants (before a solar
flare strikes).
2) An executive order which would establish a national
emergency force and plan to provide for a year's worth of backup power.
Under National Guard protection and execution, helicopter deliveries of
stockpiled fuel, replacement diesel generators, and replacement operating
and management personnel would be made available to all of our nuclear
power plants, once it becomes apparent that blackouts are imminent.
Let's not face that choice again.
Key government and military officials must think about,
and publicly discuss --how dangerous it is to continue operating our nuclear
power plants --while our good luck holds.
Sources: John Kappenman of Storm Analysis Consultants
and Metatech Corporation, as commissioned under Executive Order #13407,
NASA Planetary Sciences Director James L. Green (See the February issue
of Sky & Telescope), National Research Council Chair Daniel N. Baker
(Space Physicist),
> http://www.21stcenturysciencetech.com/Articles_2011/Spring-2011/Power_Grid_Threat.pdf
> http://www.ibtimes.com/articles/194166/20110808/solar-storms-severe-solar-storms-earth-paralyse-carrington-event.htm
* Against all the above bad news about nuclear power
plants, there's good news in that solar and wind power alternatives are
coming on line with a kilowatt-hour operating cost that's significantly
lower than nuclear power plants (aside from the inability to estimate the
costs for disposal --since no such disposal site exists).
* Hopefully, the solar and wind industry will get away
from the retail level co-generation of power, myriad complex demark/interfaces
(since power must be reliably taken off when lines are damaged), loading
home owner roofs with panels (fire and storm insurance is bound to become
a real problem), locating noisy windmills near communities --and turn instead
to distributed, professionally managed, renewable energy power plants.
* Retail energy storage (say: via electric car batteries)
also strikes me as being hare-brained, hazardous and unreliable. I'm reminded
of 1950s notions that homes of the future would be equipped with nuclear
powered hot water heaters. Even professionally managed, large scale energy
storage can be expected to present dangerous consequences, should something
go amiss. I don't have answers here --except that alternatives to both
nuclear and fossil fuel generated power must be found.
4/27/2018: Counterpunch has published
an article
by John Laforge assuring us that our impressions about the magnitude of
the Fukushima disaster have not been based in hysteria. "Total atmospheric
releases from Fukushima are estimated to be between 5.6 and 8.1 times that
of Chernobyl, according to the 2013 World Nuclear Industry Status Report."
Fukushima is the worst nuclear disaster in history.
About this web page and service:
* I started it by default of anyone else doing this work
for my part of Oregon (which I found hard to believe). Until a new Radiation
Network private station appeared in Florence in 2014, I remained the only
entity, public or private, doing and posting regular monitoring along the
Oregon coast.
* I no longer make much of an effort to popularize
my own monitoring numbers --which (to date, and thankfully) have been
steady and mild. I worry about giving people false assurances, and should
my numbers go up, I'd worry about spreading false alarms. However, it would
be wrong to stop keeping and posting this record --as long as my equipment
holds up.
* Although I've been monitoring each day and watching
the minute-by-minute log for spikes, my manually composed graphs over the
first quarter of 2015 were no longer continuous --just representative --for
an assortment of reasons: We stopped paying Charter Communications^
$55/mo for Internet access (something which once cost $10). Trundling down
to our library for a short period of access meant higher priority Internet
traffic came first. Also, I became discouraged. The CPMs barely change
--which is good news, of course, but also: I didn't
know what I was counting, and I couldn't get definitive answers.
* I created this Web page (thanks,
NeoCities!) after the system at www.RadViews stopped loading my graphs.
I've dedicated our old Dell laptop to Geiger counting/logging 24/7. Both
the computer and the outside Geiger counter (a GMC-200) have battery back
up, allowing reliable and continuous 24 hour averaging with minute-by-minute
logging and spike alarming.
^ Even though the fine print cites
"Charter Communications" on my latest Internet service offer, the big print
is doing business as "Spectrum". The printed offer states that my "address"
is "prequalified" to be connected for only $14.99/month, but an earlier
such offer indicated that becomes about $20/month to include a WiFi router.
(Our Chromebooks are WiFi only). When I asked about these offers at the
local Spectrum office, one representative said we'd get "means tested"
(which usually means there needs to be a young student or someone in the
house on some type of assistance --which is not the case here), but the
other implied we wouldn't. When I asked how long that price would last,
his answer: "until there's a price increase".
Other Monitoring Services
* Sunshine Coast Computer Club,
Inc.:
> http://sccc.org.au/archives/2630
Peter Daley's SCCC web site based monitoring, record
keeping and public presentations are exemplary. More-over, he backs up
his monitoring with the demanding work of gamma spectrometry on consistently
captured and prepared samples. Peter maintains an extensive list of
international radiation monitoring stations --at:
>
http://sccc.org.au/wp-content/uploads/2016/07/International-Radiation-Monitoring-Station-List.pdf
* GQ's Geiger Counter World Map:
> http://www.gmcmap.com/
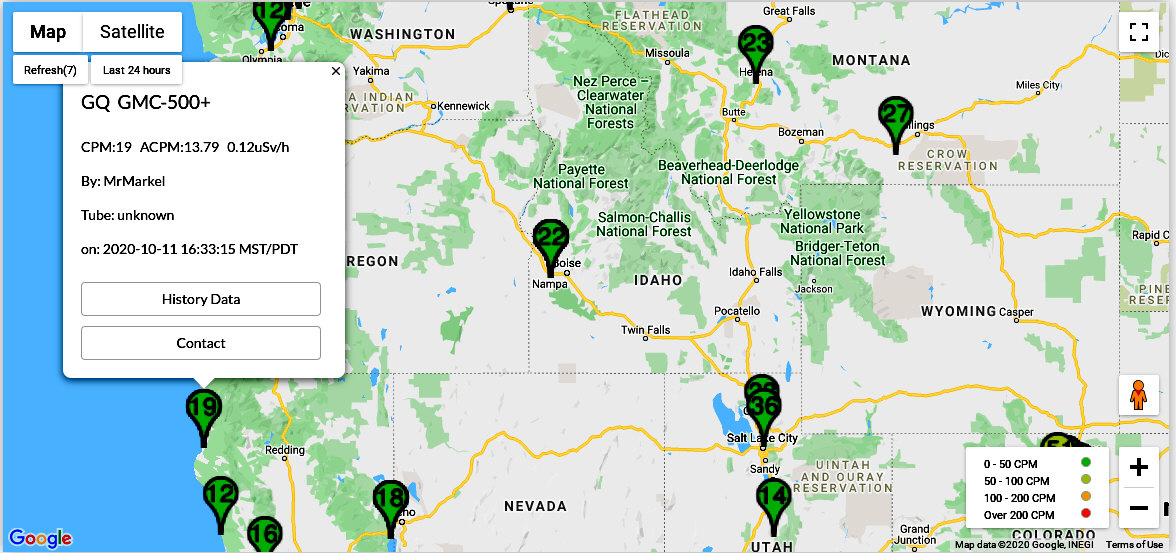 Last time I looked, GQ Electronics' World Map was displaying
more than 100 stations across the United States, which had logged on and
refreshed their reports during the previous 24 hours. (My outside station
uses one of GQ's counters.) An advantage to this network is that most of
its stations appear to use one of GQ's (affordable) counters, and (last
I checked) those counters all use the same G-M tube/s. More-over:
if you click on any of these stations, you get its long term average and
its CPM history. (Nice going, GQE!) I've always found GQ responsive
and they're considering my recent suggestion to automatically "equalize"
these mapped stations by displaying their counts as percentages --of each
station's average (next time they decide to overhaul/reprogram their
system). Meanwhile, we need only click on any station in question to get
that contextual information.
Last time I looked, GQ Electronics' World Map was displaying
more than 100 stations across the United States, which had logged on and
refreshed their reports during the previous 24 hours. (My outside station
uses one of GQ's counters.) An advantage to this network is that most of
its stations appear to use one of GQ's (affordable) counters, and (last
I checked) those counters all use the same G-M tube/s. More-over:
if you click on any of these stations, you get its long term average and
its CPM history. (Nice going, GQE!) I've always found GQ responsive
and they're considering my recent suggestion to automatically "equalize"
these mapped stations by displaying their counts as percentages --of each
station's average (next time they decide to overhaul/reprogram their
system). Meanwhile, we need only click on any station in question to get
that contextual information.
Like the other private networks on this list (to the best
of my knowledge), there may be suggestions, but no hard rules as to station/shelter
construction, locations and maintenance (as one would expect of a networked
weather station). However: since GQ's G-M tubes mainly respond to gamma
(and very hard beta) radiation, and since most residential construction
is fairly transparent to gamma, station-to-station consistency is probably
good enough. I'd certainly join this network if I were on-line here.
* EnviroReporter:
> http://www.enviroreporter.com/
There's very much to see at Michael Collins' EnviroReporter
web site --and: you can easily get at all of the EPA-RadNet station graphs
--in
their original 9 channel format. See:
> https://www.enviroreporter.com/radnet-air-monitoring-data/
* Radiation Network:
> http://www.radiationnetwork.com/
> http://www.radiationnetwork.com/Message.htm
* At the "Message" link, Mineralab/Radiation Network owner
Tim investigates and posts what I consider to be honest and rational reports
about unusual readings across his network. (Yes: he has identified what
appear to be actual radiation alerts.) Unfortunately, very few alerts are
attended to with follow-ups. I understand that a comprehensive "Alert Log"
is being developed for a future version of RN.
* Perhaps the strongest feature of RN is its "All Station
Average" graph:
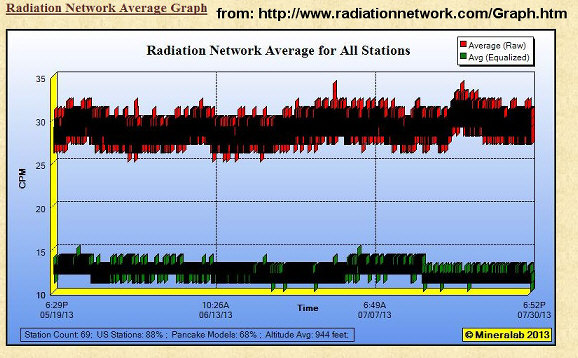 --which I'd much prefer to see as a single black line (hour
averages, say) against a white ground.
--which I'd much prefer to see as a single black line (hour
averages, say) against a white ground.
* Radiation Network's stations report in "CPM":
counts per minute, which makes a lot more sense than uSv/hr or uR/hr when
the source is not known. Unfortunately, different Geiger counters have
different sensitivities, which RN's map icons and legend attempts to take
note of, by distinguishing between "high" and "normal" sensitivity instruments
(thus: those two graphed lines/bands).
* For presentation on their public (Web page) map, the
determination of individual station trends and "Alert" status is being
averaged over intervals longer than a minute.
* Radiation Network's current "Alert Level" of 100 CPM
was a good compromise choice, but later it was individually adjusted to
accommodate the disparities among their monitoring stations.
* None of the stations are characterized as to what's
being counted or how and where those instruments are positioned --but (again),
high and normal (low) sensitivity stations are identified and their responses
are being roughly equalized as to trend status. {2/9/2019:
This web site is still functioning, but the "Alerts" seem dated. We're
unable to access individual station radiation histories.}
* RadNet:
> http://www.epa.gov/radnet/radnet-data/index.html
Not to be confused with "Radiation Network",
RadNet is the EPA's no-bid private contractor for keeping tabs on radiation
blowing across the United States. It's performance and readiness over the
years has been disappointing. Last I looked, RadNet's data was posted to
the public as one-line (all gamma counts totaled) graphs. To get at the
original 9 energy channel format, scroll down at EnviroReporter's
web site. Seeing historical RadNet data (and current data in context)
use
to require an NETC membership, but I've recently (September
2020) seen a statement there that "everything is free".
* RadWatch (fka: The BRAWM Team)
University of California's Berkeley Campus
Air Monitoring:
> https://radwatch.berkeley.edu/airsampling
I've not checked this site recently, but they didn't
seem to be up to speed in the past. I've been unable to reach them with
questions. They were at one point doing great and professional work, monitoring
milk, water and air filters, plus explaining the complexities of radiation
science.
{2/9/2019: I checked in today and this
web site looks operational. They've added synchronized (rate of) rainfall,
wind/direction and solar activity. I'll have to spend more time there and
make a better report.}
* NETC:
> http://netc.com/
It's not clear to me how their "RadCon" levels are determined
on their public map, so I tend not to pay them much mind --plus: it use
to cost $20 per year for a paid subscription. However, on my most recent
visit I saw the statement: "everything is free". Network owner Harlan
has done an exemplary job of graphing years worth of RadNet's(!) and NETC's
private stations --with your choice of averaging and time spans (wow!).
The
many stations on NETC's map/s are displayed with status symbols that are
based on each station's long term average (yay!). NETC reaches into Japan
as well. Here's an example of the NETC's graphs:
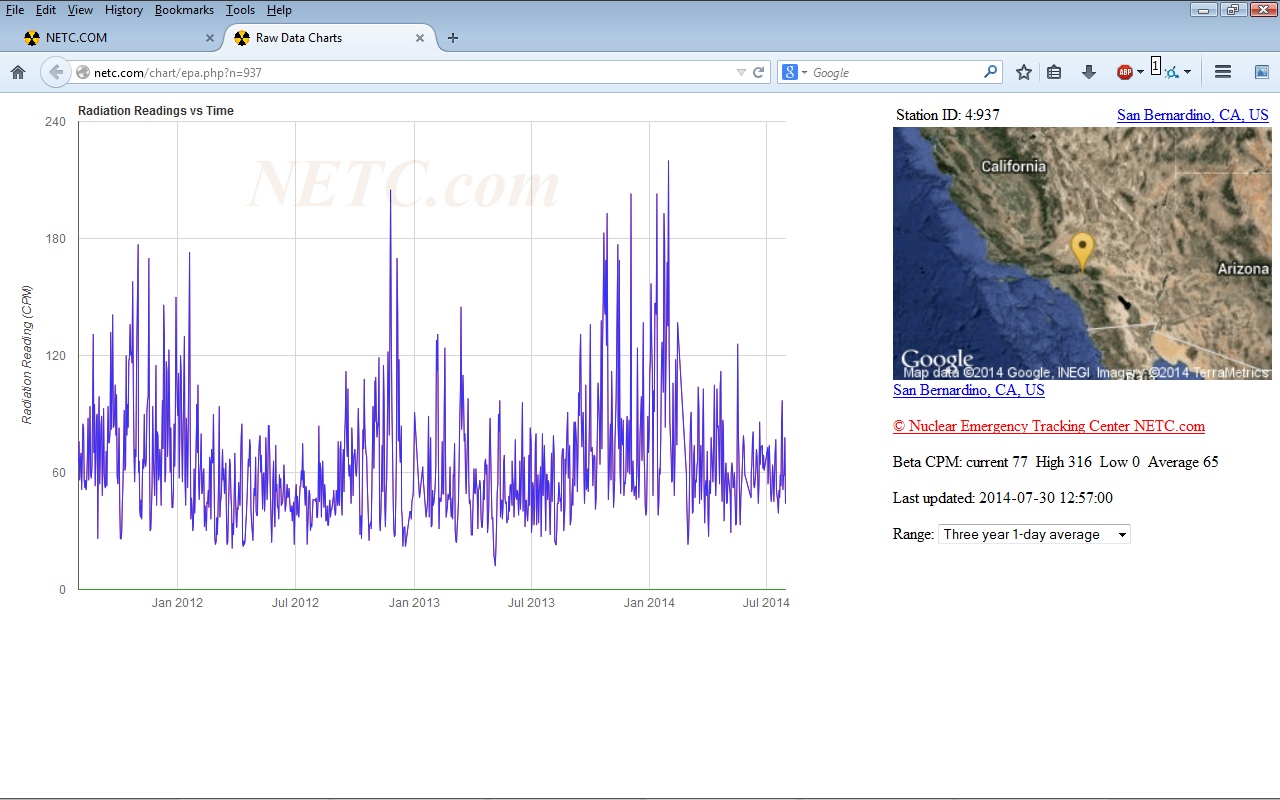
3 Years of (day averaged) beta data for San Bernardino,
California (click to enlarge this image.)
* Black Cat Systems:
> http://www.blackcatsystems.com/RadMap/map.html
The main advantages of this private network are equalized
monitoring stations which use Black Cat's excellent software and Geiger-Mueller
tube sensing units. Black Cat posts no characterizations for its stations
--no matter how high they might read. I see no station graphs.
* uRADMonitor
> https://www.uradmonitor.com/
--which is run by one Radu Motison. He apparently supplies
DIY automatic reporting device kits which detect a variety of polluting
factors (to judge from a recent promotional video). He's setting up a serious
monitoring network. (I'm doubtful about DIY kit based networks, however.
Standardization and quality control in equipment and methods are vital
for reliable data.)
* Germany's Network:
> http://odlinfo.bfs.de/
> http://translate.google.com/translate?sl=auto&tl=en&js=n&prev=_t&hl=en&ie=UTF-8&u=http%3A%2F%2Fodlinfo.bfs.de%2F
(My outside station is affordably modeled on theirs.
They've also responded to my questions.) {2/9/2019:
I was unable to click on and get at any station histories, although that's
nominally still in the offering.) (2/10/2019: Still no histories.)
My Choice of Geiger Counters and
Radiation Units
(partially revised: 1/5/2017)
** Were I now just starting out to monitor local background
radiation,
I'd very likely purchase the GMC-320 version-4, produced
by GQ Electronics.
This affordable (currently: $118 via Amazon.com
for the version-3), self-logging Geiger counter has a timed total count
function (like the expensive counters: Gamma-Scout, Inspector, Mazur, etc).
Both versions 3 and 4 permit outside monitoring (sealed up with desiccant
in a "Ziploc" freezer bag and placed in a steep roofed "bird house" shelter)
without having to bury cable to it, since you can periodically take it
back into the house or office for a minute-by-minute debriefing to your
computer --or simply to read its display for the day's timed count (say:
12 to 24 hours).
~ If you go this route, be sure to let the Ziploc
bagged/packaged 320 (or any other such instrument) warm up to within 5
degrees of room temperature before opening it in the house. (The 320
displays its own internal temperature --nice!)
~ The 320 is a bit power hungry, so if you plan
to leave it in the shelter for (say) a week at a time, replace its lithium
battery with a good brand name lithium having a 2500mah capacity. (My current
outside unit is a cabled GMC-200 --which uses the same G-M tube as the
320.) See
here for more about my setup.)
* The earliest graphs on this page
report Geiger counter ("GC") radiation measurements in terms of indicated
"uR/hr" (micro-REMs per hour, which equals uSv/hr times 100) --"dose rate"
units. The use of Geiger counter "REM" units (Roentgen equivalent man")
is nearly always invalid since it's supposed to be about a hypothetical
person's received bodily dose from a single, defined, external, isotope
source. My Quarta-Radex and Medcom "Inspector" Geiger counters' REM calibrations
can only be roughly correct for a cesium-137 source. For other types
of radiation --like external alpha radiation (which doesn't even penetrate
the skin), it becomes meaningless. In short: a (windowed) Geiger counter
counts alpha, beta, weak and strong gamma as equal *clicks* --but they
are not physiologically equal.
(The other radiation unit you'll encounter is the "gray"/"Gy",
which is usually the same as the "sievert" for gamma radiation.)
* The alternative of simply using "CPM" (counts/clicks
per minute) is far more rational and honest --but unfortunately, people
are using many different GCs which report varying CPMs for the same kind
and intensity of radiation. However, since most GCs have been factory calibrated
to yield similar uR/hr or uSv/hr values for cesium-137 under similar circumstances
--we can at least hope to get similar readings with respect to "background"
radiation by using those "dose" units --especially if our radiation sources
are largely gamma/photonic in nature.
* After buying a Medcom "Inspector" Geiger counter
with CPM readouts
(and alpha sensitivity), I began
logging my readings as "counts", averaged to counts per minute, over long
periods of time (usually: 10 to 100 minutes).
** However: for 2014 through to the present, I've been
logging very long term averages (now about a 24 hour count each day) --as
a percentage of my outside station's average for the first two weeks of
2014. I think that beats any other radiation unit --for integrity,
station-to-station comparisons and for avoiding confusion.
** During the first hours of the Fukushima disaster,
our government's and the Navy's estimates of radiation exposure were being
logged and quoted with errors of up to 1000x, simply because they were
not prepared to convert between the several units which are still in use:
milli, micro and pico versions of REMs, Rads, Sieverts, Grays and a variety
of CPM rates from various instruments --not always correctly deployed and
read.
* That (the above) all having been said, and for better
and worse: Europe's and Asia's government and private network's use of
Sieverts (micro and pico), their accessibility and transparency (compared
to the USA's horseshit, sweetheart contracted RadNet system), has pretty
much set the Sievert as the standard radiation unit for us all. Some affordable
Geiger counters
only read and log in micro-Sieverts per hour.
* My average outside and inside office ambient (or "background")
readings here are very similar and usually vary from about 8 to 12 "uR/hr",
which averaged about 36cpm with the Medcom GC, but comes in close to 16cpm
with the M4011 and SBM-20 Geiger-Mueller tubed units I'm now using. But
I simply log it all as a percentage of my station's long term average.
The best policy is to -always- use Geiger counters
in the same way and at the same monitoring stations.
My Geiger Counter's Failure
* The G-M tube (an LND-7317) in my Medcom "Inspector"
Geiger counter failed. The unit still had high voltage which measured
at an indicated 480 volts, using a 40 meg-ohm loading probe. (The unloaded
voltage might well be the 500v that the 7317 is rated for.) I can only
assume that the brief starting voltage (too brief to see w/o an O-scope?)
is in the range of the specified 400v to 425v.
* The Inspector's electronics counted up when I brushed
the isolated test probe across the G-M tube anode connection^.
^**^ Caution: Don't have the G-M tube in the circuit
when you do this test! As little as 20pF (20 uuF) of external capacitance
to circuit ground (like what's between the test leads from your meter),
if placed directly across a G-M tube, can destroy it, so if the G-M tube
is in the circuit,stand off your test probe with at least a 4.7 meg-ohm
resistor at the tip. (I like to use the input resistance of the volt
meter for the stand-off resistor --so I can simply double what's displayed.
By knowing the combined DC probe impedance of your meter, and knowing
the effective source impedance of the circuit you're probing, you can multiply
the display voltage by whatever factor is required --should you need to
know the unloaded voltage in a high impedance circuit.)
* Unimpressed by the life span of my pancake G-M tube
(AND its original 90 day warranty via Medcom --extended to a full year
in 2014), I replaced it with a Russian SBM-20, which can be had for about
$35 (maybe $20 if ordered direct from an old Soviet country). These are
tough, durable puppies with about 43% the gamma sensitivity of an LND-7317,
no low energy beta sensitivity, and (of course) no alpha sensitivity at
all.
* The operating voltage and the initial voltage had to
be reduced to about 400 and 300 respectively. Consequently, I added a high
resistance voltage divider consisting of five 10 megohm ("10M") resistors
between the original G-M tube anode connection and circuit ground, then
tapped off about 380 volts after the first 10M. That first 10M (R1) is
bridged with a 15pf (15 uuf) disk capacitor (C1), so that the Inspector's
electronics can feel the brief pulses. (Ctrl+ to enlarge this image.)
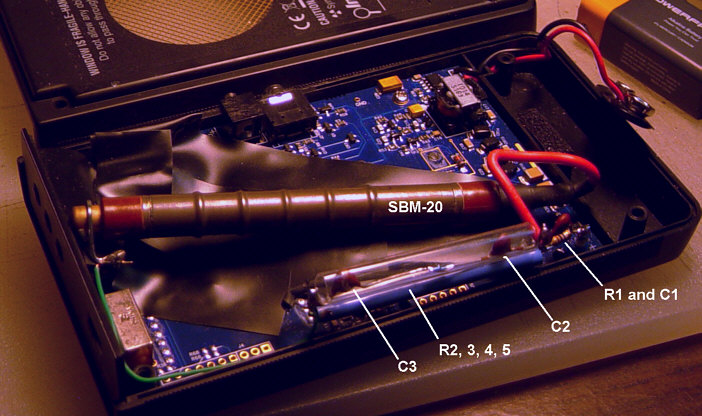 The following four 10M resistors (R2 through R5) are bridged
with two 15pf capacitors (C2 and C5) in series, such that only 2/3rds of
the initial supply voltage is felt by the SBM-20 tube.
The following four 10M resistors (R2 through R5) are bridged
with two 15pf capacitors (C2 and C5) in series, such that only 2/3rds of
the initial supply voltage is felt by the SBM-20 tube.
* This modification resulted in a steady 2ma drain
on the 9v battery (18 milliwatts) --for about 23 days of battery life,
where I use to get about 3 months per battery. However, I no longer
use this Geiger counter continuously. (Even though the divider string only
accounts for only 4.2 milliwatts, one might consider doubling all of the
resistors.)
It's my guess that this will degrade the high rate performance
of the tube, but by using a pulse data cable connection to my PC, the high
end already starts rolling off above 5000cpm anyway, and badly above 15,000cpm
(compared to Inspector's internal rating as being good to 350,000cpm --with
the original G-M tube, of course).
* With an SBM-20, the uR/hr display would of course
be way off, but I've only ever used timed CPM totals (since the Inspector's
sampling period is only 30 seconds or less for anything else).
* I operated my Medcom Inspector pretty much continuously
for the first 14 months. In an average 36cpm background field of radiation,
that works out to 22 million total counts (2.2 x 10^7), whereas the expected
G-M tube life is quoted at from 10^9 to 5 x 10^10 total counts --so it
failed about 100 years short of the mark.
* References:
> http://www.lndinc.com/products/17/
> http://www.gstube.com/data/2398/
My comments, questions --and drivel
* Radium and X-rays --the first
radiation sources to be commercialized and medicalized before WW-1, were
greeted with open arms, as was "atoms for peace" and nuclear power after
WW-2. It's hard to believe how much radiation children were subjected to
as a shoe sales gimmick (previous to 1960, via fluoroscopy: 16 to 75 REM/min
to the feet, above 0.1 R/hr at a distance of ten feet from the front of
the unit)--! Scores of young women ingested radium in the course of "pointing"
the brushes they used to paint watch dials. There was a pottery factory
in San Francisco which made radium laced water cooler/dispensers that they
shipped nationwide. (I photographed an old one in Minnesota.) Stenciled
on its side were instructions to drink several glasses of water from it
each day for good health. The December 1915 issue of Scientific American
cited a company which sold radium in the form of fertilizer, to be distributed
at the rate of one pound per 50 square feet. That article faulted this
product as being not nearly enough to make a difference, and that enough
would simply be too costly. With a half-life of 1590 years, remnants of
these products, especially at old warehouse and factory locations, must
remain a hazard.
* While all radiation carries an estimable hazard
(per:
> https://www.freespeech.org/video/theres-no-such-thing-safe-level-radiation
--so do things like getting out of bed in the morning,
breathing city air, driving a car, etc. --all of which a rational, caring
person (especially a parent) attempts to minimize. Possibly it's the case
that a healthy person's body is usually able to repair the damage (at a
cellular level) --for the prevailing rates of "background" radiation --at
least in one's ancestral home. Whether or not that's the case, the hazards
of external radiation can at least be rationally compared
to every-day exposures --natural (like the radiation from potassium 40
in your own body) and artificial (like disturbing the ground for your home's
foundation), which seem largely unavoidable in modern life.
That having been said: you especially want to minimize
eating/drinking, breathing in or somehow wearing a radioactive substance.
You also want to avoid counsel from anyone who proposes to compare ingesting
radioactive substances to chest X-rays, sunshine, air travel, or eating
bananas.
See the preamble to this page
for my latest take on what the heck it is I think I'm counting.
* Our society needs supportive feedbacks at all levels,
but does not have a method certain for earnest amateurs (once upon a time
encouraged with the title: "citizen scientists") --to get competent counseling.
~ This is a much broader issue in
that many amateur interest groups (concerned with [say] UFOs, contrails,
fluoridation, vaccines, 911 and other issues/conspiracies) --find themselves
isolated and left to their own --perhaps self-defeating-- devices, methods
and assumptions. These factions then drift further apart from the "main
stream" and from each other.
Be my guess: this is due to that familiar "high school
popularity contest effect". The competent professional (usually educated
at great public expense) can not personally afford to engage such people
(the public), lest s/he suffer the "de classe" effects of being tainted
by association with the "great unwashed" or "the wrong sort", or get stupidly
quoted out of context, or perhaps flat out misquoted --thus ending up with
less credibility among and traction with his/her colleagues --on that slippery
upward slope toward a successful career. The integrity, coherency, mutual
respect and trust of our society suffers as a consequence.
* As to the integrity of traditional handheld Geiger
counters, I can answer that one. Despite recent versions being explicitly
designed and sold for background radiation monitoring, their original purpose
was for use as survey instruments --to help clean up a messy lab, to be
deployed during an accident or an attack involving radioactive materials.
Typically, they're calibrated at a level of 1000 uR of cesium-137 radiation
--100 times above my average background levels.
That be as it may, we use them in our monitoring work
because they're affordable ($100 to $1000).
* At first I thought that my Geiger counter background/baseline
readings were mostly about "NORM" --naturally occurring radioactive
material/isotopes in the ground, beach sands and in the air --plus any
fall-out from the events in Fukushima Japan or elsewhere. (I use to supplement
my fixed station readings with remote beach station readings and occasional
one-shot
air filter readings, plus outsourced gamma spectrometry for suspicious
filters.)
* Then I became persuaded that I'd been largely counting
"muons" --those secondaries which reach the Earth, generated by the
steady rain of cosmic primary rays, but Robert Hart (see:
>http://www.hardhack.org.au/cosmic_ray_telescope
--and others suggested that the muon component (at sea
level) amounts to 10% or less of even a low background count.
* As of July, 2016, it appears that about half of a count
at low "background" levels (say: 10 uR/hr) is cosmogenic plus a minority
of internal G-M tube noise. (It's tough to discern the difference. A coincidence
detection setup should help.)
* On 5/25/2016 I submerged my
mobile Geiger counter to a depth of 2 meters --off the end of a dock
on our salt water bay (using an old army ammo box for a pressure vessel).
 I followed that up with another 30 minute run with the box
suspended just above and touching the water's surface. That resulted is
a significantly reduced count (to about 65% of what would normally be expected
--a meter off the beach) (which I verified the next day: see run "run
g").
I followed that up with another 30 minute run with the box
suspended just above and touching the water's surface. That resulted is
a significantly reduced count (to about 65% of what would normally be expected
--a meter off the beach) (which I verified the next day: see run "run
g").
My earlier submersion tests had cut the counts roughly
in half.
* Previous shielded tests indicated an irreducible minimum
in the range of 75%. Another test run on 5/30/2016 (lead shielding only)
indicated a 72% remainder (of noise/whatever).
~ *Click
here* to see my data and supportive particulars. Perhaps you can
draw more informed conclusions.
* Adding to the confusion is that Tom "Anti-Proton"
(nom-de-Net) has repeatedly passed through medium altitude null zones of
close to zero Geiger counts
--when taking his Geiger counters and a
compact scintillator/gamma spectrometry setup along on his many business
related airline flights. (I believe that Tom is too well informed/experienced
and equipped --to have been fooled by sensor overload.)
* A Geiger counter's own internal noise might be
sourced from the G-M tube or other materials in the Geiger counter.
--Those counts, of course, would not have been reduced by submersion --or
truly effective shielding.
You might find it dismaying to check the noise specifications
for your Geiger counter and/or its G-M tube, which is variously listed
as "self", "own", "inherent" or "maximum shielded background". (They don't
seem to like the term "noise".)
The noise in some G-M tubes is rated in "CPS": counts
per second. For instance: the big Russian "SBM-19" G-M tube's specifications
indicate an "inherent counter background" of 1.83 pulses per second --which
would be a whopping 110cpm (--SHEESH!). My outside station's G-M tube
(an M4011) lists noise at 76% of my long term average --and a drop
to 75% is what I got by packing an SBM-20 tubed counter of mine in 40 pounds
of lead shot. (Lead shot is a poor substitute for the good stuff used in
a gamma spectrometry lab, but it's cheap, widely available and it packs
well.)
* Straight away, I hope you can see the consequence.
Let's say your averages go up from 35cpm to 40cpm. That might not be a
14% increase in what we're worrying about (Fukushima or domestically sourced
radioactive contamination). It might actually be a 250% increase --right?--
but after an atmospheric or oceanic plume of radioactivity arrives, perhaps
it won't look like much of a change in a Geiger counter's total counts
(noise + muons/whatever + an actual on/in the ground increase). (As of
July, 2016, I'm assuming that most "noise" is due to cosmogenic radiation,
and that all noise makes up about half of a count at an indicated "10 uR/hr".)
2/9/2019: To anyone marketing radiation
monitoring equipment, software and networking.
Suggestions:
* Try to keep the station keepers' network simple and
free of meaningless "noise" by using sealed (from dust/particles) outdoor
housings plus moderate beta and alpha shielding as a default station
configuration. Everyone's automatic reportage should be mostly a gamma
count.
* In order to log any environmental beta and alpha,
offer sampling equipment and simple but methodical procedures for doing
so --especially standard air filters (cut to fit N95
material), PVC holders and a small (affordable to purchase and ship), known
air flow, network system standard, cannister vacuum cleaner unit.
* All stations should be logging (and/or via their
software) on the same UTC, 24 hour time line.
* All stations should be reporting counts as a percentage
of their station's base line average (say: the first two weeks of operation).
Existing stations should be encouraged or automatically required (via default
software settings) to do another base line, all at the same time of the
year.
* Software generated network graphs should all be for
the same UTC periods (24 hours, week-long, etc.). While day graphs might
show unembellished, super-imposed lines for 1 minute, 10 minute and hour
long counts (like my modified Mineral Lab "GeigerGraph" system graphs),
week-long graphs might be only hourly counts, month and/or year-long graphs
would show day averages.
* When the public accesses a national map of participating
stations, clicking on any one of them should bring up at least a graph
of day averages (gamma only/mainly) for the past 7 days, and preferably,
for the past 30 days --similar to the German
network.
6/16/2015: * That 6/9 peak extended into the 2nd day
with what looks something like a decay curve. I've seen no such readings
elsewhere, so I'm still guessing it was a neighbor's bout with "nuclear
medicine", but using something other than technetium-99m.
6/8/2015: Have begun watching for (and noting)
10 minute averaged periods which reach or exceed 4.4 standard deviations
(21cpm), per my copy of a GeigerGraph beta program. It may be (and has
already been) that highs occur without an accompanying 1 minute count peak
(of any special note) --and vice-versa.
5/25/2015b: I've discontinued my 30 minute remote (beach
and bay) station counts in favor of beach "wanders".
* The difficulty of getting qualified comments about
radiation issues is disappointing. I'm old enough to remember a readiness
among the academically/professionally qualified to encourage earnest amateur
pursuits and the "citizen scientist". Of course there use to be more willingness
to uncritically accept authoritative answers, and now there's the Internet.
I imagine that professionals are apprehensive about being blaringly misquoted
out of context, held up to ignorant ridicule, becoming suspect of indiscretions
with "privileged information", and simply being widely seen to be consorting
with the academically unwashed.
5/24/2015: * I reached back and added a percentage
range to all the program generated graphs --which made for an interesting
review. At some point --shortly after my Medcom Inspector Geiger counter
failed, and maybe about the time I broke my leg, I seem to have gotten
about 1cpm out of calibration, as I transitioned through my 2nd and then
to a 3rd Geiger counter. The graphs themselves, however, evidence what
the equivalency should be, so that's what I've gone by. (Tentatively: I'm
claiming that my new SBM-20 G-M tube "matured" into a bit more sensitivity.)


